Power BI Dashboards & Reports
Interactive, governed dashboards and paginated reports your leadership actually opens, iterated in working sessions on Singapore hours.
AI forecasting & Q&AOne page from a senior architect, within two business days. The single highest-payback AI move in your Odoo, Adobe or custom stack, and the two things to leave alone. Yours to keep.
One page from a senior architect in two business days: your highest-payback AI move, and what to leave alone.
/ Business intelligence for Singapore
Most Power BI problems are upstream. We model the warehouse, agree the definitions once, then build reports finance and operations can both sign. Delivered from our Singapore office, with refresh schedules, row-level security and the semantic model documented.
/ The BI practice
Business intelligence solutions for Singapore enterprises mean dashboards, the models beneath them and the pipelines that feed them, run as one governed system rather than a folder of reports.
Governed Power BI dashboards for sales, operations and finance, designed so the Monday trading meeting runs off one screen rather than four exports.
Semantic models with row-level security put every team on the same definitions, so two departments stop bringing two different numbers to the same meeting.
SSIS and Azure Data Factory pipelines pull POS, CRM, ERP and marketing data into one clean warehouse on a refresh schedule the business can trust.
Ageing SSIS jobs and hand-run exports become monitored pipelines with data-quality checks, so reporting stops depending on one person’s laptop.
A pragmatic plan for sources, ownership and KPIs, scoped with your Singapore stakeholders before any licence or build is paid for.
Predictive models on top of the warehouse turn history into demand, revenue and risk forecasts, with anomaly alerts the moment a metric moves.
Reports embedded in the portals and apps your teams and customers already use, so insight travels instead of waiting in a workspace.
Documentation, training and refresh monitoring hand the platform to your own analysts, with our engineers behind them on Singapore hours.
Trusted by 2,000+ brands across Singapore, APAC and beyond












/ Proof from our global case studies
Regional programmes first; global work from the same bench follows.
Accounting, Manufacturing, Sales, HR and Payroll consolidated on one Odoo 19 Enterprise platform.
Open the case study →
One unified web platform, with a 34% drop in compliance issues.
Open the case study →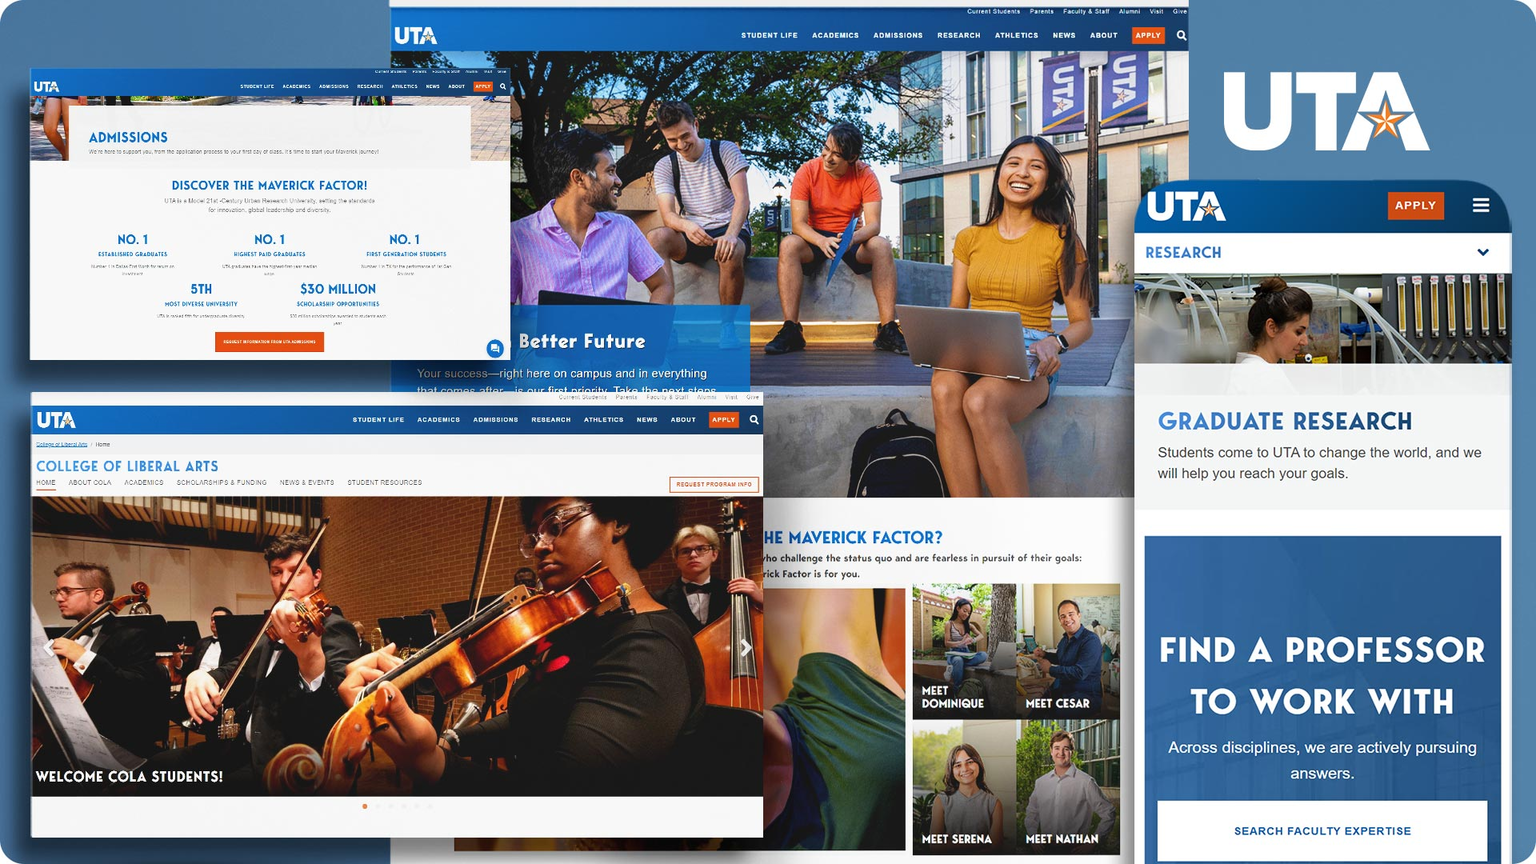
Six-month hypothesis-driven CRO programme: +8% cart-to-conversion, +6% cart-to-checkout.
Open the case study →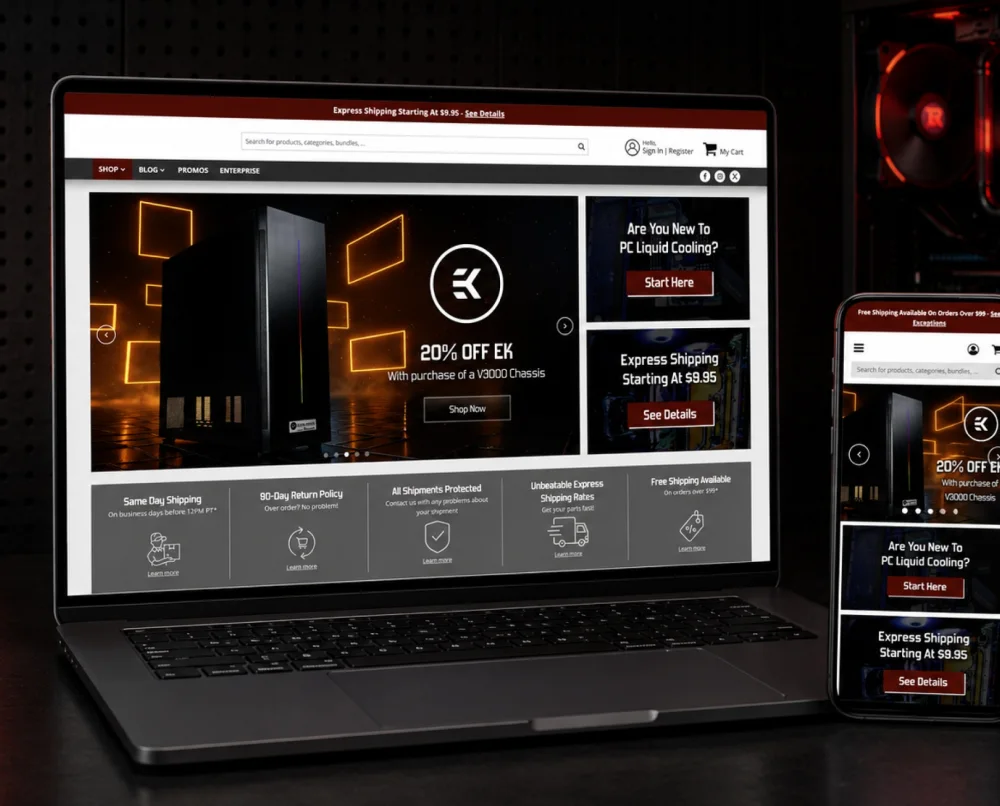
Each card is tagged with its region and the work it covered. Microsoft credentials for this market are on our Singapore Microsoft partner page, the Power Platform side is on Power Apps in Singapore, and the Singapore engagements we can name are on our Singapore case studies page.
/ What we build
Power BI consulting for Singapore covers eight practice areas under one accountable team: dashboards, semantic models, ETL and SSIS, SSAS, warehousing, data strategy, predictive analytics and embedded BI.
Interactive, governed dashboards and paginated reports your leadership actually opens, iterated in working sessions on Singapore hours.
AI forecasting & Q&ASemantic models, row-level security and one version of the truth, so every report answers from the same definitions.
AI data classificationETL that pulls POS, CRM, ERP and marketing data into one clean warehouse, and legacy SSIS packages rebuilt into monitored pipelines.
AI data-quality & reconciliationMultidimensional and tabular models for fast, sliceable analysis, with measures and hierarchies your analysts extend themselves.
AI-assisted model designWarehouse architecture on SQL Server and Microsoft Fabric for reporting at scale, sized to what your data actually needs.
AI schema & partition tuningSources, ownership, KPIs and access mapped before the build, so the platform earns trust from its first refresh.
Data roadmapForecasting, segmentation and scoring on top of the warehouse, turning trading history into decisions for the quarter ahead.
AI forecasting & propensity modelsBI embedded in your apps and portals so insight travels with the team, wherever the business gets managed from.
AI anomaly alerts on the go/ How we deliver
Source systems to a governed dashboard on a predictable path: a named owner, a working demo at every stage, ceremonies on Singapore time.
Frame the KPIs with your Singapore stakeholders, audit every source system, and capture PDPA and residency requirements before any build.
Stand up the warehouse and semantic model, with SSIS or Azure Data Factory pipelines built and tested against your live sources.
Reports iterate in working sessions on Singapore hours until the numbers match what finance signs off, then roll out with row-level security.
Refresh monitoring, usage tracking and training hand the platform to your analysts, with our engineers behind them as needs grow.
/ The BI stack
Power BI, SSIS, SSAS and SQL Server, with Microsoft Fabric and Azure data services, deployed in Singapore regions where residency matters.
Interactive, governed dashboards, paginated reports and natural-language Q&A, built by a Microsoft Solutions Partner with 14+ years on the Microsoft stack.
ETL that pulls POS, CRM, ERP and marketing data into one clean warehouse, with data-quality checks and reconciliation as it moves.
Multidimensional and tabular models for fast, sliceable analysis, with measures and hierarchies your analysts can extend.
Warehouse architecture on SQL Server and Microsoft Fabric for reporting at scale, on one engineering standard.
Secure pipelines, storage and compute on Azure, with Singapore-region deployment where residency matters.
Forecasting, anomaly detection and report narratives built on top of the stack, so a report answers the question instead of raising four more.
/ Accelerators
Semantic models, ETL patterns and data-quality tooling from earlier BI programmes come packaged, so your first governed dashboards stand up in weeks rather than a fiscal year.
A semantic model and dashboard library stood up on your data, with AI Q&A and report narratives from the first release.
A governed warehouse with reusable SSIS ETL patterns and data-quality checks running against your source systems.
/ In their words
Brainvire demonstrated reliability, a commitment to delivery, and helped us maintain momentum on critical roadmap items.
/ On the record

Brainvire configured our system with minimal customisations and delivered in a very short timeframe, saving us time and cost.


Brainvire has been invaluable, on budget and very responsive. They’d bend over backwards to help us in every way they can.

Brainvire has helped our business grow, it feels like a true partnership. Seven great years, and we’re looking forward to more.

We’ve worked with Brainvire for six years. They’re task-oriented and great at turning projects around in an expedited fashion.

Brainvire built a really good plan for my business, brought consistency, and took a lot off my hands. I can’t say enough good things.

Brainvire is a real partner, very different from other outsourcing companies. They’ve mastered communication and delivery.

The Brainvire team has lived up to every commitment. They gave us a part-naming convention that lets us configure our product line.

Brainvire’s response is always fast, and their delivery has been quick and elevating. I really recommend their services.
/ Recognition
 2025
The Americas' Fastest-Growing Companies
 2025
Fastest-growing private companies in America
 2024
North America's fastest-growing tech companies
 2024
Top B2B service provider, global rankings
/ Reporting, in this market
Where your dashboards get built and reviewed, where the data behind them sits, which of your existing systems feed them, and who runs the platform afterwards.
Dashboard walkthroughs are held on Singapore time with delivery leadership at our Singapore office, so definitions, thresholds and access rules are argued over with your team in the room before a report ships, not summarised afterwards.
Warehouses, pipelines and Power BI capacity can sit in the Singapore regions of Azure, and the architecture note names the region each component runs in, so an internal risk review has a single document to read.
Dashboards draw from the ERP, commerce and marketing systems your business already operates, the same delivery muscle behind our Singapore AI and analytics practice. Source data is treated under the PDPA from the first workshop, with access recorded per field.
Semantic model documentation, refresh monitoring and training transfer the platform to your own team, with our Microsoft solutions team for Singapore behind them as the estate grows.
/ Frequently asked questions
Yes. Delivery leadership for this market sits at our Singapore office, with 1,000+ engineers across 10+ global offices behind it. Our Singapore Power BI work includes a custom dashboard engagement for a Singapore-based retailer stocking over 13,000 products from 400 brands, covering consulting, UI/UX design and custom report development.
Four to eight weeks is the working range for our Power BI accelerator, which stands up a semantic model and dashboard library on your data. The exact timeline is set in discovery, where the state of your source systems, not the ambition of the mock-ups, is what moves the date.
Yes, that is routine work for a team with 14+ years on the Microsoft stack. Ageing SSIS packages and hand-run exports are rebuilt into monitored pipelines on SSIS or Azure Data Factory, with data-quality checks and reconciliation added as the data moves, so the numbers leadership sees are the numbers they can trust.
In the Singapore regions of Azure wherever your policy calls for it. Before the build starts you receive an architecture note naming the region for the warehouse, the pipelines and the Power BI capacity, so an internal risk review reads one document instead of holding a conversation. Where the warehouse sits, who can see which rows and how long refresh history is kept are agreed before build and documented for PDPA.
No. A first dashboard suite can run against your existing databases and exports, and that is often the right way to prove value. A warehouse enters the plan when volume, history or the number of source systems makes direct connections fragile, and discovery tells you which side of that line you sit on.
Brainvire is a Microsoft Solutions Partner with 14+ years on the Microsoft stack, covering Power BI, SQL Server, SSIS, SSAS and Azure. Credentials and the wider Microsoft practice for this market are on our Singapore Microsoft partner page.
A Power BI consultant turns raw data into insights and reports that people use for business decisions. Our consultants agree the KPIs with your team, connect the sources, build the data models and dashboards, and set up row-level security so employees see only the rows they are allowed to see. The work ends with documentation and training for your analysts.
Brainvire is a Microsoft Solutions Partner with 14+ years of experience on the Microsoft stack. One team owns the warehouse, the semantic model, the reports and the handover. Reviews run on Singapore time with delivery leadership at our Singapore office.
Yes. Microsoft describes Power BI as its business analytics platform and as a core component of Microsoft Fabric. It sits in the Microsoft Power Platform with Power Apps, Power Automate, Copilot Studio and Power Pages, and works with Excel, SQL Server and Azure.
Partly. Microsoft lists three per-user license types: Fabric (Free), Power BI Pro and Power BI Premium Per User (PPU). A free license lets a user create reports and dashboards for their own use, but not share them or collaborate with others. Pro and PPU users can share with free users when the content sits in a workspace on Premium capacity or Fabric F64 or larger. We size the licenses your teams need in discovery.
For reporting shared across a team, Power BI is usually the better fit. It adds a governed data model, scheduled refresh, row-level security and dashboards many people can open at once. Excel stays useful for ad hoc analysis, and Microsoft lets you create Excel workbooks with refreshable Power BI data, so both can read the same numbers.
A short course can cover the basics of building a report in two days. Data models, DAX and governance take longer to learn. Our handover trains your analysts on your own semantic model, with a written guide to its measures, so their skills grow on the data they use every day.
Fees depend on the number of data sources, the state of that data and how many reports the first release needs. We price the work after discovery, once that scope is clear. Power BI licenses are a separate cost.
Yes, we work with organizations of every size. Startups usually begin with a few dashboards on the data they already have. Enterprises often need a warehouse, governance and reports for many business users. The same team scopes both, and the first release is sized to what you need now.
Yes. Delivery runs from our Singapore office on Singapore hours, and teams across Southeast Asia can work from the same model and reports. Row-level security keeps each country team on its own rows.
Data accuracy starts in the pipelines. We add data-quality checks and reconciliation to every load, so totals are matched against the source system before a report refreshes. Refresh monitoring flags a failed check, so the team can fix the load before the next meeting.
Microsoft says Power BI Desktop connects to more than 100 data sources, including databases, cloud services, files and web sources. For data integration across ERP, CRM, POS and marketing systems, we build data pipelines into one warehouse, so every report draws on the same datasets.
Slow reports usually come from the model rather than the visuals. Wide tables, unused columns and heavy calculations make every page wait. Our data optimization work trims the model, moves logic upstream into the warehouse and sets incremental refresh where the history is large.
The common risks are unclear KPI definitions, poor source data, open access and no owner after launch. We deal with them in order: definitions agreed in discovery, data checks in the pipelines, row-level security before rollout, and trained analysts before handover.
It puts the same information in front of everyone. When finance and operations read the same numbers from one model, meetings move from arguing about data to decision making. Forecasts and anomaly alerts on top of the warehouse help teams spot potential problems earlier.
Yes. Microsoft describes Fabric as an all-in-one analytics platform that includes Power BI as one of its core workloads, and says existing Power BI content and workspaces stay the same. We design analytics solutions on Fabric, SQL Server or Azure to fit the data ecosystems you already run.
It helps. Microsoft documents that row-level security restricts data access for specific users of a Power BI semantic model. With access rules agreed before build and an architecture note naming where data sits, your PDPA and compliance reviews start from one documented design.
Refresh monitoring, usage tracking and training stay with the same team after launch. Our engineers support your analysts on Singapore hours as new reports, data and users are added.
Finance teams use Power BI for management reporting and analysis. Retail and logistics teams track sales, inventory, supply chain, warehousing and transport, and analyze customer behavior. Risk teams build compliance and ESG reporting. Forecasting on the same model moves a team from reporting the past to planning ahead.
Yes. A regional headquarters can compare each country on the same KPI definitions, with row-level security keeping each team to its own rows. Executive dashboards give leadership one view of the key KPIs, and every figure traces back to the same model.
/ Next step
Thirty minutes with a Brainvire BI consultant on Singapore time, and you leave with a scoped plan for your first governed dashboards: sources, model, timeline.
Get your Power BI rollout scoped →Cookies on this site
Essential cookies are always on. They keep the site secure and make forms work.
We also use Google Analytics and Microsoft Clarity to see how the site is used. We only turn these on if you accept.