Optimizing Diagnostic Analytics with Custom Dashboards: The Data-Driven Revolution in Manufacturing
-

Pratik Roy

In the relentless race of modern manufacturing, speed alone doesn’t win—it’s the combination of speed, precision, and insight that defines leaders. With razor-thin margins and rising expectations, manufacturers are under pressure to detect inefficiencies, eliminate waste, and consistently produce high-quality products at scale.
One of the most transformative tools driving this evolution is diagnostic analytics—particularly when paired with custom dashboards. These dashboards don’t just report on what’s happening—they dig deep into why it’s happening. From pinpointing equipment malfunctions to tracking operator-induced errors, custom diagnostic dashboards are turning factories into smart, self-improving ecosystems.
In this comprehensive guide, we’ll explore how manufacturers can optimize operations by leveraging diagnostic analytics through customized dashboards. We’ll walk through the fundamentals, real-world applications, step-by-step implementation strategies, and how to future-proof your analytics infrastructure.
The Analytics Spectrum—Why Diagnostics Matter
In the era of Industry 4.0, manufacturing organizations are inundated with data from various sources, including machines, sensors, supply chains, and more. Transforming this data into actionable insights is crucial for enhancing efficiency, reducing downtime, and maintaining competitiveness.
Understanding the different types of analytics—descriptive, diagnostic, predictive, and prescriptive—is essential for leveraging data effectively. This article explores these analytics types, highlighting the crucial role of diagnostic analytics in identifying the root causes of issues and driving informed decision-making in manufacturing.
The Four Types of Analytics
1. Descriptive Analytics: What Happened?
Descriptive analytics involves summarizing historical data to understand past events. This could include reports on production volumes, machine utilization rates, or defect counts over a specific period in manufacturing. These insights help organizations recognize patterns and trends, serving as a foundation for further analysis.
2. Diagnostic Analytics: Why Did It Happen?
Building upon descriptive analytics, diagnostic analytics seeks to uncover the reasons behind observed outcomes. By data analytics and consulting services and patterns, manufacturers can identify root causes of issues such as equipment failures or quality defects. This understanding enables targeted interventions to address underlying problems.
3. Predictive Analytics: What Will Happen?
Predictive analytics uses historical data and statistical models to forecast future events. This might involve predicting equipment failures or demand fluctuations in manufacturing, allowing for proactive planning and resource allocation. This kind of foresight becomes even more powerful when paired with heavy equipment maintenance software, which enables real-time monitoring, automates maintenance scheduling, and ensures critical issues are addressed before they disrupt operations.
4. Prescriptive Analytics: What Should We Do About It?
Prescriptive analytics recommends actions based on predictive insights. By evaluating various scenarios and their potential outcomes, manufacturers can determine optimal strategies for maintenance scheduling, inventory management, and production planning.
The Importance of Diagnostic Analytics in Manufacturing
While descriptive analytics tells you what happened, diagnostic analytics explains why it happened. This distinction is critical in manufacturing, where understanding the root cause of a problem is essential for implementing effective solutions.
Use Case: Bottling Plant Throughput Decline
Consider a bottling plant experiencing a 15% drop in throughput. Descriptive analytics highlights the decline, but diagnostic analytics reveals the cause: a robotic arm operating more slowly due to uncalibrated sensors. Identifying this issue allows the maintenance team to recalibrate the sensors, restoring optimal performance.
Implementing Diagnostic Analytics: A Step-by-Step Approach
- Data Collection: Gather data from various sources, including machines, sensors, and production systems.
- Data Integration: Consolidate data into a centralized platform for comprehensive analysis and reporting.
- Data Cleaning: Ensure data accuracy by removing inconsistencies and errors.
- Analysis: Use statistical methods and visualization tools to identify patterns and correlations.
- Root Cause Identification: Drill down into the data to uncover the underlying causes of observed issues.
- Actionable Insights: Develop strategies to address root causes and prevent recurrence.
Benefits of Diagnostic Analytics in Manufacturing
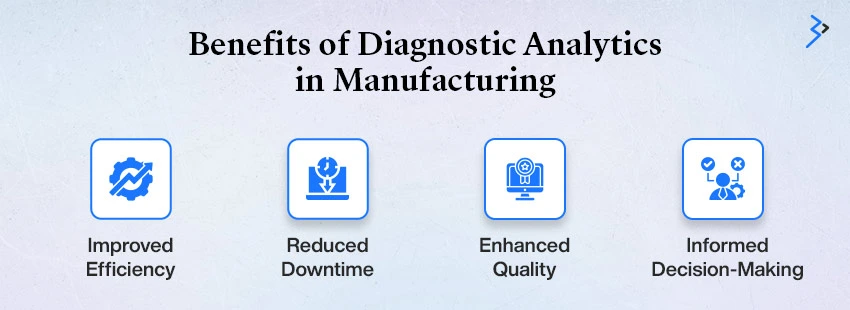
- Improved Efficiency: By identifying and addressing root causes, manufacturers can streamline operations and reduce waste.
- Reduced Downtime: Early detection of issues allows for timely maintenance, minimizing production interruptions.
- Enhanced Quality: Understanding the factors contributing to defects enables quality improvements.
- Informed Decision-Making: Data-driven insights support strategic planning and resource allocation.
Anatomy of a Custom Diagnostic Dashboard
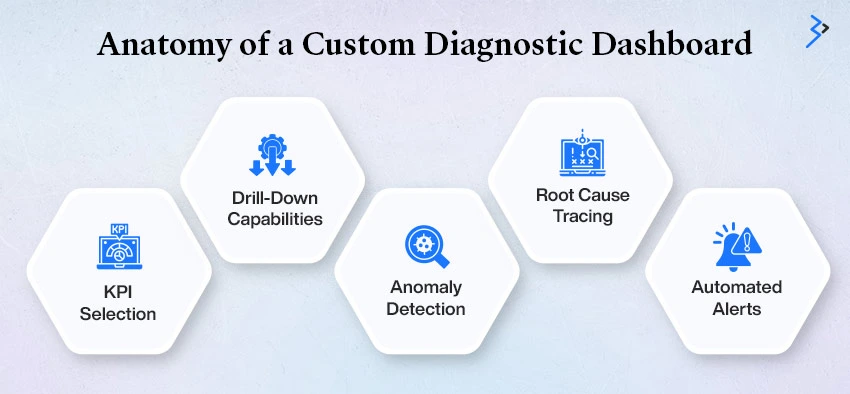
A well-designed diagnostic dashboard acts as the nerve center of a smart manufacturing operation. While every dashboard must be tailored to an organization’s specific goals, systems, and constraints, several components are standard to all high-performing dashboards. These features provide visibility, enable timely decision-making, and support continuous improvement.
1. KPI Selection
The right set of Key Performance Indicators (KPIs) is at the heart of any diagnostic dashboard. These aren’t arbitrary—they reflect the organization’s core operational goals. Typical diagnostic dashboards track:
- Machine Downtime: Tracks when and why machines stop, helping to reduce productivity losses.
- Defect Rates: Measures quality at each stage to pinpoint where defects originate.
- Throughput Efficiency: Evaluates how much product is produced within a set timeframe.
- First Pass Yield (FPY): Indicates how many units pass inspection the first time, without rework.
- OEE (Overall Equipment Effectiveness): A composite metric that shows how well machines are performing in terms of availability, performance, and quality.
These KPIs serve as early indicators of operational issues that may need further investigation.
2. Drill-Down Capabilities
One of the most powerful features of a custom diagnostic dashboard is its ability to move from high-level summaries to granular data points. Users can filter by shift, machine, operator, or production batch. For instance, if OEE dips below a threshold, managers can click on the metric to identify the root cause, such as excessive downtime, poor quality, or slower-than-expected cycle times. This traceability allows for faster and more effective problem-solving.
3. Anomaly Detection
To make issues immediately visible, dashboards use visual cues such as red/yellow/green status indicators, flashing icons, or heat maps. These elements alert teams when performance deviates from acceptable norms. For example, a red icon might signal a sudden spike in defect rates, prompting immediate investigation before the issue cascades across production lines.

4. Root Cause Tracing
Beyond simply highlighting problems, diagnostic dashboards provide interactive tools to explore their origins. Clicking on a faulty KPI might reveal a specific machine that caused the delay or highlight a pattern across a particular shift. These tools help correlate anomalies with contributing factors like material quality, operator performance, or equipment age, enabling data-backed root cause analysis.
5. Automated Alerts
Custom dashboards often integrate with real-time alerting systems. Notifications via email, SMS, or internal tools are triggered when a metric crosses a pre-set threshold. This ensures supervisors and technicians are informed immediately, minimizing the time between problem detection and resolution.
Read More – A Step-by-Step Guide to Building a Power BI Interactive Dashboard
Building the Business Case—Why Dashboards Are Worth the Investment
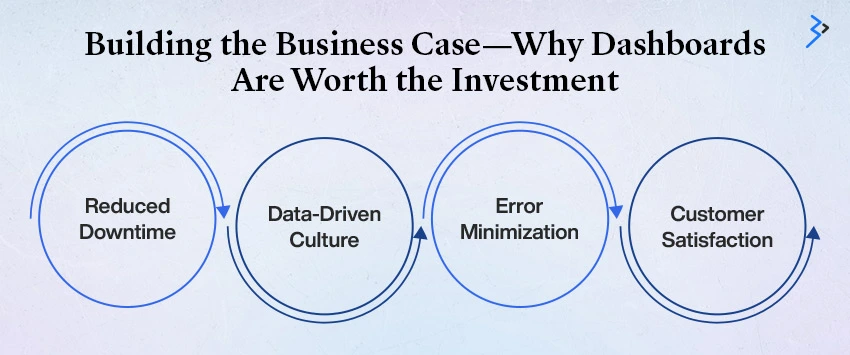
Manufacturing dashboards aren’t just a tech toy—they’re a strategic asset. Consider these high-impact benefits:
1. Reduced Downtime
With instant visibility into where and why slowdowns occur, maintenance and operations teams can react faster, preventing hour-long lags that cost thousands.
2. Data-Driven Culture
Operators and managers no longer rely on gut instinct. Decisions are now driven by data, building trust and promoting accountability.
3. Error Minimization
Frequent inspection reports and real-time alerts allow issues to be fixed before they affect output.
4. Customer Satisfaction
Higher product consistency and timely delivery translate directly to happier clients—and often repeat business.
Dashboard in Action – Real-World Manufacturing Success
While diagnostic dashboards might sound like a futuristic addition to the factory floor, many manufacturers already realize tangible gains. The beauty of these dashboards lies in their ability to convert raw operational data into actionable intelligence, enabling rapid responses to process inefficiencies. Let’s explore how two distinct manufacturers turned insights into measurable improvements using custom-built dashboards.
Case Study 1: Automotive Assembly Line Efficiency
A Tier 1 automotive parts supplier, responsible for delivering critical components to global vehicle manufacturers, faced a recurring problem: inconsistent weld quality and fluctuating production speeds across four plants. Despite having a descriptive dashboard that shows general output and downtime, the team did not understand the why behind the inefficiencies.
By implementing diagnostic dashboards that analyzed real-time vibration data and torque metrics from welding robots, the team identified a recurring pattern: weld inconsistency correlated with shifts in ambient temperature. These fluctuations affected torque calibration and, over time, degraded weld quality and speed.
Maintaining the integrity of vehicle components doesn’t end at the assembly line; proper upkeep is equally vital once the vehicle is in use. For example, regular attention to undercarriage care can prevent long-term damage and performance issues—learn more about how to clean vehicle undercarriage to ensure optimal vehicle longevity
Armed with this diagnostic insight, the engineering team redesigned the robot’s welding subsystem to better compensate for temperature variation. The results were dramatic:
- 11% increase in line efficiency
- 22% reduction in defective welds
- Improved customer satisfaction and reduced warranty claims
This use of diagnostic analytics streamlined manufacturing processes and demonstrated how understanding operational causality leads to transformative decisions.
Case Study 2: Food Processing Line with Frequent Recalls
In the food manufacturing sector, quality and consistency are non-negotiable. One food processor found itself plagued with expensive and brand-damaging product recalls. Initial analysis pointed to inconsistencies in the final product, but the cause remained elusive.
The company turned to diagnostic dashboards integrated with IoT sensors that monitored temperature, humidity, and the source of ingredients throughout the production line. Within weeks, they uncovered a key insight: one mixing unit periodically recorded erratic temperature readings that led to poor ingredient blending. This mixer had previously escaped suspicion because it was within average operating limits in traditional batch logs.
After recalibrating and eventually replacing the faulty mixer, the company saw an immediate drop in inconsistency. The improvements were quantifiable:
- 80% reduction in batch quality issues
- Near elimination of product recalls
- Greater confidence from retailers and distributors
This example illustrates the power of diagnostics in the food industry, where even small variations can have significant implications for safety and brand reputation.
Implementation Blueprint—Step-by-Step to Success
While the value of diagnostic dashboards is clear, implementing them effectively requires a structured and collaborative approach. Here’s a step-by-step blueprint to guide manufacturing organizations on their journey:
Step 1: Define Diagnostic Goals
Begin by clearly identifying your biggest challenges. Ask questions like:
- Are bottlenecks slowing down your operations?
- Are there recurring equipment failures?
- Do your yield rates vary across shifts or machines?
Each question reveals the type of diagnostic KPIs and data your dashboard should focus on.
Step 2: Map Your Data Landscape
Audit your current data sources:
- PLCs (Programmable Logic Controllers)
- MES (Manufacturing Execution Systems)
- ERP (Enterprise Resource Planning systems)
- Sensor networks and SCADA systems
Determine what additional data you need and how it will be collected and integrated.
Step 3: Select the Right Tools
Choose tools that fit your technical ecosystem and scale. Options include:
- Power BI – Best for Microsoft-centric organizations
- Tableau – Excellent for advanced visualization and interactivity
- Qlik – Known for associative data exploration
- Custom solutions – Tailored for unique workflows and real-time requirements
Ensure your tools can connect to live data streams and have scalable performance capabilities.
Step 4: Collaborate Across Roles
The success of a diagnostic dashboard hinges on cross-functional cooperation:
- IT ensures data is clean, secure, and accessible.
- Operators provide real-world insights about machine learning services and workflow challenges.
- Engineers help define metrics and track process flows.
- Management sets strategic performance targets and ROI expectations.
This alignment ensures dashboards are both technically sound and practically applicable.
Step 5: Design for Clarity
A great dashboard strikes a balance between depth and simplicity. Design principles include:
- Prioritize visual clarity over data density.
- Use graphs to show trends, gauges to reflect thresholds, and heat maps to pinpoint anomalies.
- Limit the use of color to highlight important information (e.g., red for critical deviations).
Every visual element should serve a purpose, avoiding clutter and cognitive overload.
Step 6: Test and Iterate
Before full deployment, run a pilot:
- Choose one production line or plant for testing.
- Gather user feedback on layout, responsiveness, and functionality.
- Adjust based on findings—add filters, change layouts, or refine KPIs.
- Validate whether the dashboard successfully identifies root causes.
Iteration ensures the final product is user-friendly and operationally effective.
Step 7: Train the Team
Even the best dashboard will fail without adoption. Train stakeholders on:
- How to interpret metrics and visual cues
- How to use drill-down and filter features
- How alerts function and when to act
Use live walkthroughs, hands-on workshops, and quick-reference guides to drive comfort and confidence.
Custom Dashboard Best Practices
| Best Practice | Description | Actionable Outcome |
| Focus on Actionable Metrics | Display only the metrics that lead to specific actions or decisions. | Streamlines decision-making and avoids data fatigue. |
| Segment by User Role | Customize views based on the user, such as executives vs. technicians. | Ensures that each user sees relevant data related to their responsibilities. |
| Ensure Mobile Accessibility | Design dashboards to work seamlessly on mobile devices. | Enables real-time insights for field teams and maintenance crews. |
| Set Dynamic Thresholds | Use AI/ML to adjust thresholds based on patterns, not fixed values. | Improves anomaly detection accuracy and reduces false alerts. |
| Include Annotations | Allow users to add comments, explanations, or context to specific data points. | Enhances collaboration and preserves institutional knowledge. |
Challenges and How to Solve Them
| Challenge | Solution |
| Data Silos | Implement centralized data lakes or use API connectors. |
| Resistance to Change | Involve end-users early and show quick wins. |
| Legacy Equipment Without Sensors | Use retrofitting IoT solutions or manual logging for critical data. |
| Dashboard Fatigue | Keep dashboards simple, focused, and relevant. |
| Data Overload | Automate filtering and summary views to highlight only key deviations. |
The Future—Where Diagnostic Analytics Is Headed
The role of diagnostic dashboards in manufacturing will only grow as technology advances. Here’s what’s coming next:
1. AI-Powered Recommendations: Not just “why” something happened, but also what to do next—powered by generative AI development services.
2. Digital Twins: Virtual replicas of manufacturing lines will be integrated with dashboards for simulation-based diagnostics.
3. Edge Analytics: Data processed at the machine level will provide microsecond-level diagnostics for ultra-high-speed operations.
4. Cross-Company Benchmarking: Custom dashboards will pull anonymized data from industry peers, allowing for powerful comparative analysis.
Final Thoughts: Empower Manufacturing with Diagnostic Dashboards
In the age of Industry 4.0, efficiency isn’t optional—it’s existential. Custom diagnostic dashboards are no longer a luxury reserved for tech giants. They’re accessible, actionable, and essential for manufacturers looking to stay ahead.
By revealing not just what is going wrong but why, these tools enable organizations to transform from reactive to proactive. The outcome? Less downtime, higher quality, and a continuous improvement cycle that positions your business at the forefront of innovation.
Want help building your own custom dashboard solution? Let’s talk about how to start diagnosing for success.
FAQs
A diagnostic dashboard in manufacturing provides real-time insights into operational issues, helping identify the root causes of problems like equipment failure or production bottlenecks. It enables proactive decision-making and continuous improvement.
Diagnostic dashboards offer instant visibility into production inefficiencies. By identifying issues quickly, maintenance teams can act before problems escalate, minimizing delays and preventing costly downtime, leading to smoother, more efficient operations.
Key metrics include machine downtime, defect rates, throughput efficiency, first pass yield, and Overall Equipment Effectiveness (OEE). These KPIs provide a clear picture of production performance and areas that need attention or improvement.
Yes, diagnostic dashboards can be highly customized to suit specific manufacturing processes and user roles. They can display plant-wide KPIs for executives or granular data for technicians, ensuring relevance and usability for all team members.
Diagnostic dashboards enable managers and operators to make informed decisions based on facts rather than assumptions by providing actionable, real-time data. This data-driven approach fosters accountability, reduces errors, and enhances overall operational efficiency.

Related Articles
-
 Full-Stack vs MEAN Stack vs MERN Stack- Which One to Choose for Web Development?
The development of mobile apps has taken itself to the next level. Together, many innovations are being used to create smartphone applications or web apps with extravagant characteristics. The word
-
7 Reasons Why Hiring Full-Stack Developers makes more sense for your Business
In a cricket team, who is an all-rounder? Someone who regularly performs at both batting and balling, right? Similarly, a full-stack developer can handle an entire project single-handedly. They have
-
What’s New in PHP 8.5: Making Your Code Cleaner, Faster, and Easier to Debug
In the current landscape, digital velocity is the single greatest competitive advantage. The performance of your foundational technologies, like PHP, which currently underpins nearly 75% of all websites according to