Excel v/s Power BI- Time To Switch Your Reporting Practices


Modern businesses know the significance of data analysis and are trying to make the most of it. Research states that firms generate about 44 trillion GB data annually.
With such massive data in hand, firms tend to skip a major chunk of important data. A major section of the data remains not analyzed and utilized.
To avoid this, several organizations are using intelligent technologies to search for key insights and make improved decisions backed with data.
In the business world, Microsoft Excel is the preferred data management and visualization tool. This spreadsheet is widely used across several industries and small and large businesses.
As entrepreneurs recognized the importance of data, they have started implementing modern tools and technologies to take advantage of the available data.
Power BI is a contemporary data visualization tool from Microsoft. Enterprises can gain intelligence from varied sources conveniently. This interactive, secure, and easy-to-use tool offers business analytics along with intelligence services.
Power BI consulting can enlighten you with current data, intelligent features, and deep insights required for the development of your business. This tool can offer advanced facilities as compared to Excel.
Get a sneak peek through the contemporary Power BI and traditional reporting tool here-
Refined Data Accessibility
Today, data is available in multiple formats, nature, and quantity. Excel is less likely to support data from all formats.
Excel is predominantly used for computations and analysis with additional mathematical operations and functions on the data.
Excel 2013 consists of varied Power BI functionalities and features. These features help businesses to transform data into useful information. It also supports extra sources such as cubes, tables, SQL, Microsoft Azure data, and much more.
Power BI offers you the liberty to choose any type of data and stored in-
- App
- Reports
- Cloud-based sources
- CSV files,
- Workbook
- Database
- Excel
Power BI has a strong compression algorithm, which helps the tool to compress, store, access, and analyze large data easily.
Enterprises can acquire a comprehensive view of the huge data flow with the help of Power BI as it is also linked with connectors that can provide large data sets.
On the contrary, Excel has limitations and makes it tricky to work smoothly with large sets of data. You don’t have the liberty to include additional sales data to the existing one.
The updated data automatically syncs with Power BI, which is impossible in Excel. Power BI offers the flexibility and adaptability to refresh and update data automatically, reducing your overhead tasks in hand and you get the latest data.
Enriched Dashboard and Reporting
With improved features, Power BI has transformed data analysis and reporting into a handy task.
A simple Power BI report is-
- Easy to understand
- Colorful graphical representation
- Insights from different perspectives
Apart from these, reports are dynamic, interactive, and help you to make wise business decisions at a faster pace.
Simultaneously, reports can be edited to determine the changes of a single factor on the result. Resizing, different visual, filtering, and formatting are add-on features for reporting.
Power BI consists of the right tools for effective and interesting reporting experience. Reports can be acquired in a range of chart forms such as line, pie, table, area, funnel, gauge, maps, and more.
If you use Excel, you will have to transfer the data in the tabular format and then acquire various charts such as bar, column, pie, etc.
This becomes difficult when dealing with large data. Besides, Excel fails to provide flexibility and clarity for huge and quantitative data. It is more apt for structured data where you have pre-set parameters and definite data to generate reports.
Robust Data Security
Data security is one of the key concerns for almost every organization. Power BI is specifically designed with built-in security controlling properties, for the following aspects-
- Networking security
- Role-based authentication
- Risk mitigation
- Row-level security feature
- Authorization
- Session monitoring
- Cloud-based security, and much more.
Excel offers a provision that restricts access to a particular sheet for keeping your data confidential. You can either provide read-only access to others to avoid unwanted changes.
Excel also allows you to lock files and hide their visibility.
- Crystal Clear Visuals
- Different Point Of Views
Regardless of the size of the data, Power BI development can help you to comprehend it with precision. There are different functionalities and features to understand the data.
You have the potential to analyze data from different dimensions and get a 360-degree preview of the information and utilize it optimally for your business.
This comprehensive overview can highlight factors that have a dominating effect on your business or a particular department or aspect.
Made-To-Order Dashboards:
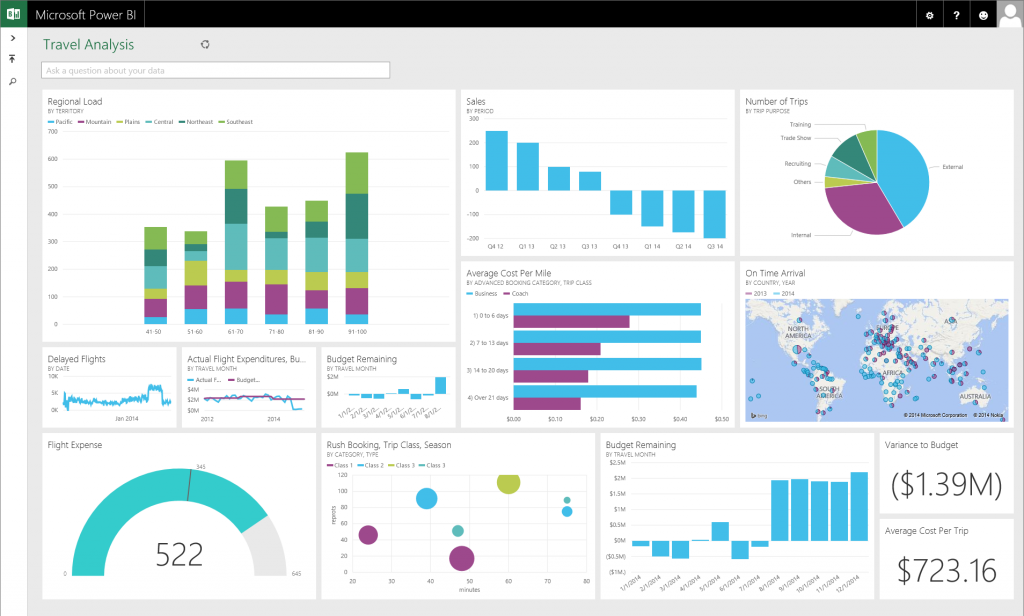
Source: Microsoft
Power BI dashboards are referred to as a canvas where you get a glimpse of all reports with snippets.
These reports are created using the plethora of data available through the multiple sources.
This customized dashboard offers you a preview of all your business activities including colorful slabs, interactive theme, and an appealing layout helps you to note the changes.
You can also alter the dashboard based on the reports or data you would want to view regularly.
Notifications
Power BI can send notifications when there are any changes on the dashboard.
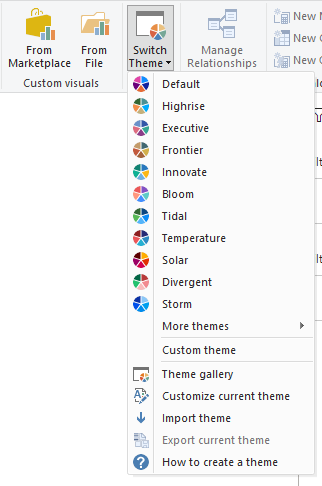
Templates
Power BI allows you to customize the template as per your business requirements. This means that your website can provide you all the necessary information and eliminate the lesser important data.
A customized theme improves functionality as you can navigate through the required tabs easily and get work done.
Takeaway
With Power BI you can work from home or any corner of your premises. The mobile app allows you to gain access from almost everywhere and carry out business operations.
A Power BI cloud solution can change the way your business observes and perceives situations and data.
Related Articles
-
 Sales Analytics – Revealing the Power of Data in Sales
In every business, irrespective of how large or small it is and the industry it’s a part of, the one question that always pops up on the agenda is ‘How
-
 Power BI Visuals: Browse Interactive And Appealing Chart Data Visualizations
Business intelligence (BI) solutions provide evidence based on accumulated data to enable better decision-making. Access to information has been democratized recently and is no longer restricted to upper-level management. As
-
 Governance for Power BI: Building Stronger Data Governance for a Smarter Future
In today’s hyperconnected, data-driven world, businesses rely heavily on analytics to stay competitive. Power BI, Microsoft’s powerful business intelligence tool, has quickly become a favorite among organizations looking to visualize,