Row-Level Security in Power BI: When and How to Set It Up?
-

Pratik Roy

In the modern data-driven world, securing business intelligence tools isn’t just a good-to-have feature — it’s an absolute necessity. As organizations increasingly turn to platforms like Microsoft Power BI to visualize, analyze, and share data across teams, maintaining the integrity and privacy of this data becomes paramount.
One of the standout features that contributes to Power BI’s popularity isn’t just its sleek dashboards or seamless integration with other Microsoft tools — it’s the robust data security framework it offers, particularly through Row-Level Security (RLS).
Imagine you’re a sales manager overseeing teams across multiple regions. You want each regional manager to access performance metrics — but only for their region. Exposing all data to everyone isn’t just a breach of confidentiality; it also creates clutter and confusion. That’s where Row-Level Security becomes your best friend.
This article will guide you through everything you need to know about Row-Level Security in Power BI — what it is, when you should use it, and how to implement it effectively.
Understanding Row-Level Security (RLS)
What is RLS in Power BI?
Row-Level Security (RLS) in Power BI is a robust capability that manages access to specific rows of data, ensuring each user only views the information they are permitted to see. Instead of building multiple dashboards for various users or departments, RLS enables you to create a single, unified report that dynamically filters content based on who is viewing it and their assigned role.
How Does It Work?
RLS works by applying DAX (Data Analysis Expressions) filters or using security roles defined within Power BI. These filters are applied to how the data is displayed to users when they access the report in the Power BI Service, not to the underlying data itself. Businesses seeking advanced data security and insights often rely on Microsoft Power BI Consulting Services to implement Row-Level Security effectively and ensure reports are tailored to each user’s access level.
For example:
- A sales manager may only see sales data for their region.
- An HR executive may only see employee information for their department.
- A financial analyst may view budgetary data limited to their business unit.
Key Features:
- Dynamic Access Control: User-specific filtering based on login credentials, often tied to Azure Active Directory.
- Centralized Reporting: One report serves multiple stakeholders without duplicating datasets.
- Role-Based Views: Assign different users to roles with customized data access policies.
RLS ensures a personalized and secure data experience, reducing administrative overhead and improving governance—all while maintaining a consistent user interface across your organization.
Why Row-Level Security (RLS) Is Essential in Power BI
Nowadays, organizations rely on data to guide decisions, track performance, and improve operations. But not all data is meant for every user. Teams often handle confidential and segmented datasets, such as customer details, HR records, financial statements, or patient information, that require strict access controls. This is where Row-Level Security (RLS) becomes not just useful, but essential.
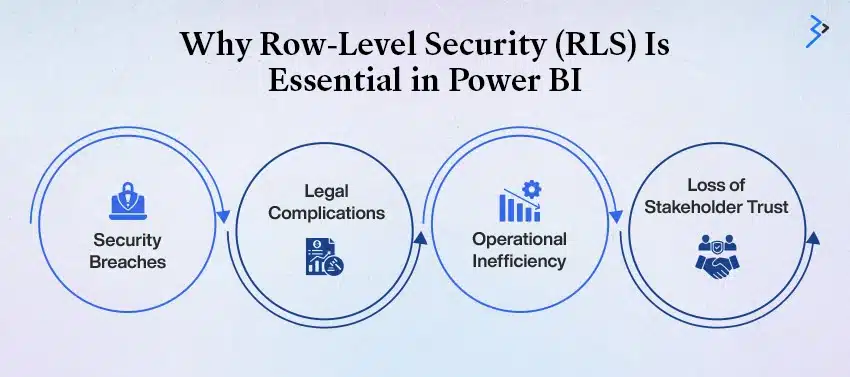
Without RLS, giving unrestricted access to reports can lead to serious consequences:
- Security Breaches: When sensitive data is exposed to unauthorized users, the risk of internal data leaks or external hacks increases significantly.
- Legal Complications: Regulations such as GDPR, HIPAA, and CCPA mandate strict control over who can access personal or regulated data. A compliance failure can result in hefty penalties.

- Operational Inefficiency: Without RLS, separate reports must be created for different departments or users—cluttering your workspace and complicating report maintenance.
- Loss of Stakeholder Trust: When users access data they shouldn’t see—like another employee’s salary or confidential customer info—it erodes trust and transparency within an organization.
How RLS Solves These Challenges
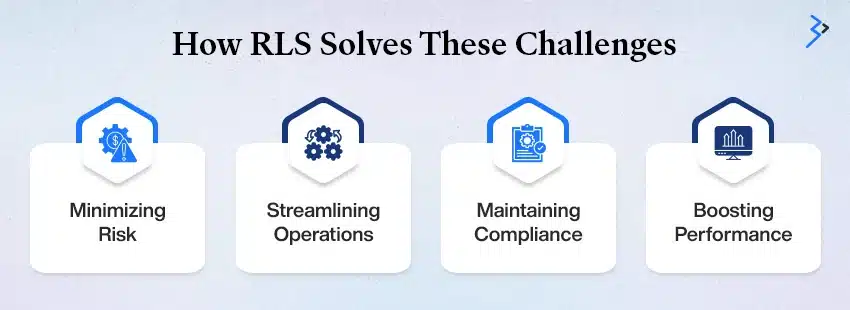
Power BI’s RLS feature addresses these concerns with a targeted, efficient approach to data access:
- Minimizing Risk: RLS ensures that users only see data relevant to them, based on their roles, departments, or other parameters. This limits the surface area for security breaches and protects sensitive information.
- Streamlining Operations: Instead of creating multiple reports for various users, you can design a single report and let RLS dynamically tailor the data for each viewer. This makes report management simpler and more scalable.
- Maintaining Compliance: With data visibility restricted by user roles or organizational hierarchies, it becomes easier to comply with regulatory frameworks like HIPAA and GDPR. RLS acts as a built-in safeguard for compliance.
- Boosting Performance: Serving a single report with filtered views is less resource-intensive than managing multiple datasets. It reduces memory usage, speeds up load times, and improves the overall responsiveness of your Power BI environment.
RLS is not just a feature—it’s a vital part of any secure and scalable data strategy. By implementing it correctly, organizations can empower their teams with insights while keeping data privacy and compliance front and center.
Read More – A Step-by-Step Guide to Building a Power BI Interactive Dashboard
When to Use Row-Level Security
Before diving into the “how,” let’s explore when RLS should be your go-to solution.
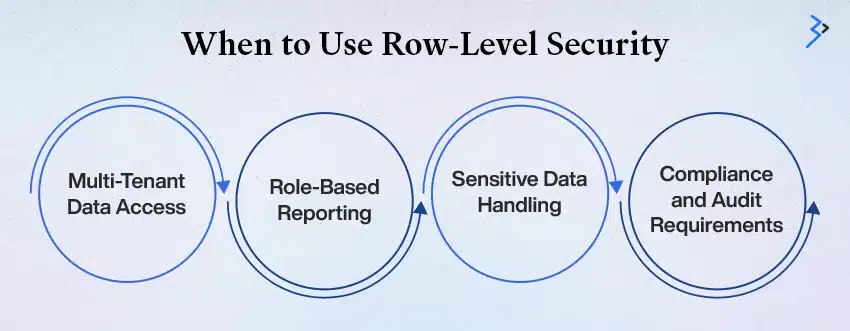
1. Multi-Tenant Data Access
If your organization uses Power BI to serve multiple clients, departments, or regions, and each one should see only their specific data, RLS is essential.
Example: A retail chain with stores in different cities wants each store manager to view only their store’s data, not company-wide metrics.
2. Role-Based Reporting
Different roles in an organization require different views of the same data.
Example: In a sales report, executives see global data; regional managers see only their territories; salespeople see only their own accounts.
3. Sensitive Data Handling
You might need to restrict access to sensitive data like employee salaries, medical information, or customer PII (personally identifiable information).
Example: HR personnel can view employee compensation details, but department heads cannot.
4. Compliance and Audit Requirements
Regulated industries like finance and healthcare demand strict data visibility controls. RLS helps enforce those controls without complicating your data model.
How to Set Up Row-Level Security in Power BI
There are two primary ways to set up RLS in Power BI:
- Static RLS – Predefined roles with hardcoded filters
- Dynamic RLS – User-specific filtering using functions like USERNAME() or USERPRINCIPALNAME()
Let’s explore each in detail.
Static Row-Level Security
Static RLS is suitable when access control rules are unlikely to change frequently. You manually define roles and apply filters directly within Power BI Desktop.
Steps to Implement Static RLS:
Step 1: Create Roles
- Open your report in Power BI Desktop.
- Go to the Modeling tab.
- Click on Manage Roles.
- Click Create to add a new role (e.g., “RegionWest”).
- Select the relevant table.
- Apply a DAX filter, e.g., [Region] = “West”.
Step 2: Test Roles in Desktop
- Use the View As Role feature.
- Choose your created role and ensure the report behaves as expected.
Step 3: Publish to Power BI Service
- Once satisfied, publish the report to Power BI Service.
Step 4: Assign Users to Roles
- Go to your dataset in Power BI Service.
- Click on Security.
- Assign users to each role you’ve created.
Pros and Cons
| Pros | Cons |
| Easy to set up | Not scalable for large user bases |
| Good for simple access rules | Requires manual updates |
| No need for user tables | Doesn’t support user-level dynamic filtering |
Dynamic Row-Level Security
Dynamic RLS is more flexible and scalable. Instead of hardcoding filters, you create a user mapping table (often called a bridge table) and use functions like USERPRINCIPALNAME() to dynamically filter data based on the logged-in user.
Steps to Implement Dynamic RLS:
Step 1: Create a User Mapping Table
Create a table (e.g., UserAccess) with at least two columns:
- UserEmail (email addresses of users)
- Region (regions they’re allowed to access)
Example:
| UserEmail | Region |
| [email protected] | West |
| [email protected] | East |
You can create this table in Power BI or import it from a data source (SQL, Excel, etc.).
Step 2: Set Up Relationships
Link the UserAccess table to your primary data table using the common field (e.g., Region).
Step 3: Define a Dynamic Role
- Go to Manage Roles.
- Create a role called “DynamicRegionRole”.
- Apply this DAX filter on the UserAccess table:
[UserEmail] = USERPRINCIPALNAME()
This ensures that only rows matching the logged-in user’s email are accessible.
Step 4: Publish and Assign Roles
- Publish your report to Power BI Service.
- Users automatically get filtered data based on their login.
Pros and Cons
| Pros | Cons |
| Highly scalable | More complex to set up |
| Easy to maintain | Requires accurate user mapping |
| Supports dynamic access changes | Requires DAX knowledge and testing |
Tips and Best Practices for Setting Up Row-Level Security (RLS) in Power BI
Row-Level Security (RLS) is a critical feature in Power BI that ensures users only access data they are authorized to view. When implemented correctly, RLS enhances data privacy, ensures compliance with data governance policies, and delivers a more personalized user experience. However, setting up RLS can be challenging without a strategic approach. Below are some tried-and-true tips and best practices to help you get it right the first time.
1. Use USERPRINCIPALNAME() for Compatibility
When writing DAX expressions to filter data based on the current user, always use the USERPRINCIPALNAME() function rather than USERNAME(). This is because USERPRINCIPALNAME() aligns with the user’s Azure Active Directory login and works consistently across Power BI Service. In contrast, USERNAME() might only return the machine name or domain details in Power BI Desktop, leading to inaccurate filtering during testing.
2. Create a Master User Table
A best practice in any scalable RLS implementation is to create a centralized “user mapping” table. This table should list each user along with attributes such as region, role, department, or any relevant hierarchy. Populate this table directly from a source like Azure SQL, SharePoint, or Excel. Keeping this table updated allows for flexible and dynamic filtering without altering the report structure every time roles change. Organizations often work with a Microsoft Azure Consulting and Integration Company to ensure seamless integration and management of such user mapping tables across their data platforms.
3. Test Extensively Before Publishing
Power BI Desktop offers a powerful feature called “View As Role.” Use this to simulate how different users experience the report based on the roles you’ve defined. This feature is invaluable for identifying logical errors, ensuring filters work as intended, and verifying the user’s access boundaries before publishing your report to the Power BI Service.
4. Keep Relationships Clean and Simple
Data model relationships can make or break your RLS implementation. Ensure there’s only one active relationship between your user table and fact tables to avoid ambiguous or incorrect filtering. Avoid complex bidirectional or circular relationships unless absolutely necessary, as they can complicate RLS logic and lead to performance issues.
5. Avoid Hardcoding Email Addresses
Hardcoding user emails into DAX filters may work initially, but quickly becomes unmanageable. Instead, leverage your master user table to handle dynamic access. This method is not only easier to maintain but also scales better as your organization grows and changes.
6. Combine Static and Dynamic RLS When Needed
In complex scenarios, it’s often useful to combine both static and dynamic RLS. For instance, static filters can handle role-based access (e.g., “Finance department sees only financial data”), while dynamic filters adjust based on the specific user (e.g., “John from Finance sees only Q1 data”). Combining both methods ensures precise and flexible access control.
Common Use Cases of RLS in Power BI
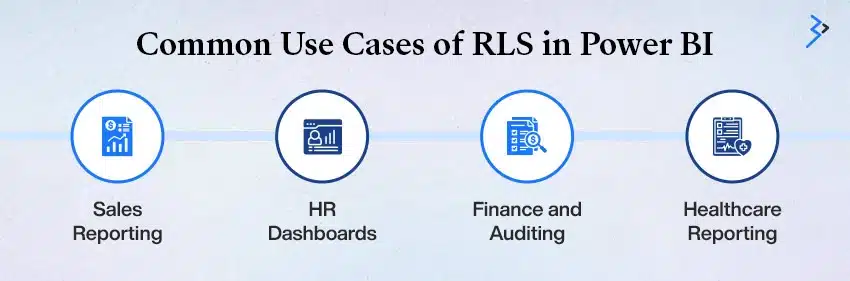
- Sales Reporting: Limit visibility to region-specific data. Sales reps can only view their own leads and performance metrics.
- HR Dashboards: Restrict access to employee data like personal details and compensation based on department-level permissions.
- Finance and Auditing: Ensure each department views only their budgets and expenditure reports without accessing company-wide financials.
- Healthcare Reporting: Comply with privacy laws like HIPAA by restricting access to patient or doctor-level data based on assigned roles.
Properly implemented, RLS not only safeguards your sensitive data but also ensures a tailored experience for every user. By following these best practices, you’ll set the foundation for secure, efficient, and scalable Power BI reports.
RLS in Power BI vs Other BI Tools
Power BI’s RLS is often compared with similar features in tools like Tableau and Looker. Here’s how it stacks up:
| Feature | Power BI | Tableau | Looker |
| User-Based Filtering | Easy with DAX | via User Filters | with User Attributes |
| Role Definitions | Built-in GUI | with Permissions | via LookML |
| Scalability | High | Medium | High |
| Cloud Integration | Excellent (Azure) | Good (Tableau Cloud) | Excellent (Google Cloud) |
Power BI provides a good balance of simplicity, flexibility, and integration, making it ideal for organizations using Microsoft Office 365 Services and Azure.
Troubleshooting RLS Issues
1. Blank Report after Applying RLS
- Likely cause: The user email doesn’t match any record in the user table.
- Fix: Verify that the email in USERPRINCIPALNAME() exists in the user mapping table.
2. Users See More Data than Expected
- Cause: Misconfigured relationships or roles not applied.
- Fix: Double-check relationships and confirm users are added to the correct roles in Power BI Service.
3. Report Works Locally but Not Online
- Cause: USERNAME() vs USERPRINCIPALNAME() mismatch.
- Fix: Always use USERPRINCIPALNAME() for compatibility with Power BI Service.
Future of Data Security in Power BI
Microsoft continues to enhance security and governance in Power BI. Features like sensitivity labels, data loss prevention (DLP) policies, and Azure Active Directory integration are strengthening how organizations secure and manage their data.
RLS is expected to evolve further with:
- Integration with Microsoft Entra ID (formerly Azure AD)
- Improved role inheritance and management
- AI-based anomaly detection in access patterns
Read More – Governance for Power BI: Building Stronger Data Governance for a Smarter Future
RLS: Your Data’s Bodyguard
Row-level security in Power BI is more than just a feature—it’s a strategic tool to protect data, enhance user experience, and maintain compliance. Whether you’re handling sales data, HR records, or multi-tenant dashboards, RLS empowers you to share insights confidently and securely.
By understanding when to use RLS and mastering how to implement it statically and dynamically, you position yourself as a Power BI pro capable of delivering secure, efficient, and scalable reporting solutions.
FAQs
RLS is a feature that restricts access to specific rows in a dataset based on user roles, ensuring that each user sees only the data they are authorized to view.
RLS enhances data security by ensuring sensitive information is only visible to authorized users, streamlining reporting, maintaining compliance, and reducing the need for multiple reports.
To set up RLS, create roles in Power BI Desktop, define DAX filters for each role, and then assign users to these roles in Power BI Service after publishing.
Static RLS applies fixed filters based on user roles, while dynamic RLS filters data based on the individual user’s identity, making it more flexible and user-specific.
Yes, you can combine static and dynamic RLS in a single report, allowing fixed filters for some data and user-specific filters for others, based on the situation.
You can use the “View as Role” feature in Power BI Desktop to simulate different user roles and verify that the filters are working correctly before publishing your report.
Related Articles
-
 Power BI Consulting Services – MS Excel Power BI Data Types
The Progress of Excel There is no doubt that presently Excel has evolved to become the ultimate decision-making application. It allows to leverage the flexibility of the two-dimensional grid and
-
 Microsoft Fabric vs. Power BI: Choosing the Right Tool for Your Data Journey
Businesses today are flooded with data from countless sources—internal systems, customer interactions, market trends, and more. But the true value of data lies not in its volume, but in how
-
What is Power BI: Your Questions Are Answered by a BI Consultant
In this modern era, with massive digital information being generated every hour, it is safe to say that data has become every business’s lifeline! But collecting enormous amounts of data