About Project
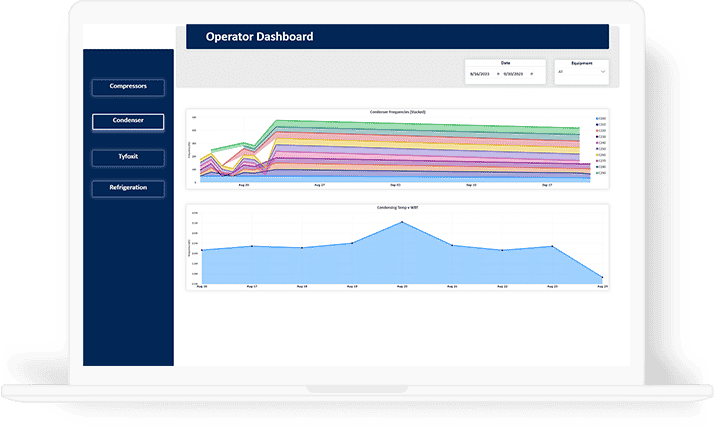
They wanted to create thumbnails for headings and subheadings in the Finance dashboard, and in the Lizard Utilities dashboard, they wanted visualizations to display the temperature, pressure, and energy consumption.
Web
Platform/OSFinance
Category
Brief
Brainvire’s team developed two dashboards to give the client visibility. They developed a financial dashboard containing thumbnails and icons that redirect to the respective reports using the embedded URL associated with the icon. In the second dashboard, Brainvire’s development team made the visualization for different sensors and equipment present in the factory.
Highlights
Brainers understood the client’s requirements thoroughly to provide the best possible solution. They developed financial dashboards to provide client visibility. The team developed a visualization for different sensors and equipment present in the factory. Brainvire’s team ensures that the best technical solutions for all their clients are provided in a minimum time frame to reduce expenses and help them maximize ROI.
Case StudyFeatures
Line Chart:
Users get data on the working conditions of equipment from the line chart for respective dates.
24-Hour Interval:
The values are displayed with a 24-hour interval time between the readings.
Estimate Breakdown Time:
Users can estimate the breakdown time of sensors and find the total energy consumed.
Clear Values:
Displaying clear values on the y-axis.
Tech Stack
Power BI
Azure DevOps
Data Lake
