
Home / Case Studies / Power BI SaaS Platform
/ Case Study · Information Technology
A SaaS Platform for Power BI Reports. Real-time Data, Predictive Insight.
/ The engagement
Business Intelligence, Delivered as SaaS.
A SaaS business intelligence platform built on Power BI, with real-time data scheduling, sales forecasting, performance auditing, and multi-KPI reporting for SMB and mid-market clients.
/ About the client
The client is a turnkey solution that lets SMB and mid-market businesses use business intelligence and analytics at an affordable price, analyzing huge chunks of data to guide decisions.
As a trusted Microsoft gold partner, Brainvire brought its Power BI specialists together to build a web platform that mines data, runs predictive analytics, and turns reporting into clear, real-time insight.
/ The approach
Design, architecture, and features, shipped as one program.
Always current
A scheduled refresh brings real-time data into the reports, so decisions rest on the latest numbers rather than stale extracts.
See what is next
Predictive analytics forecast the full production cycle from sales, helping clients plan ahead with confidence.
Audited and safe
The platform audits user activity, detects potential security issues, and captures deadlock information to keep production healthy.
Progress in view
Multiple KPIs in a single list measure organizational performance and highlight where to focus next.
/ What stood in the way
Four problems, solved without a maintenance window.
Select a challenge to see how it shaped the build.
Inform business decisions
Decisions needed live data. Our team built a scheduled refresh that brings real-time data into every Power BI report.
Forecasting the sales
The client wanted to predict output from sales. We enabled sales forecasting that projects the complete production cycle.
Monitoring the production environment
The production environment needed watching. We added auditing that detects security issues and captures deadlock information.
Multiple KPIs in one list
Leaders wanted many measures at once. We surfaced multiple KPIs in a single list to track organizational progress.
/ Product screens
The delivered experience.
The interface people actually use.
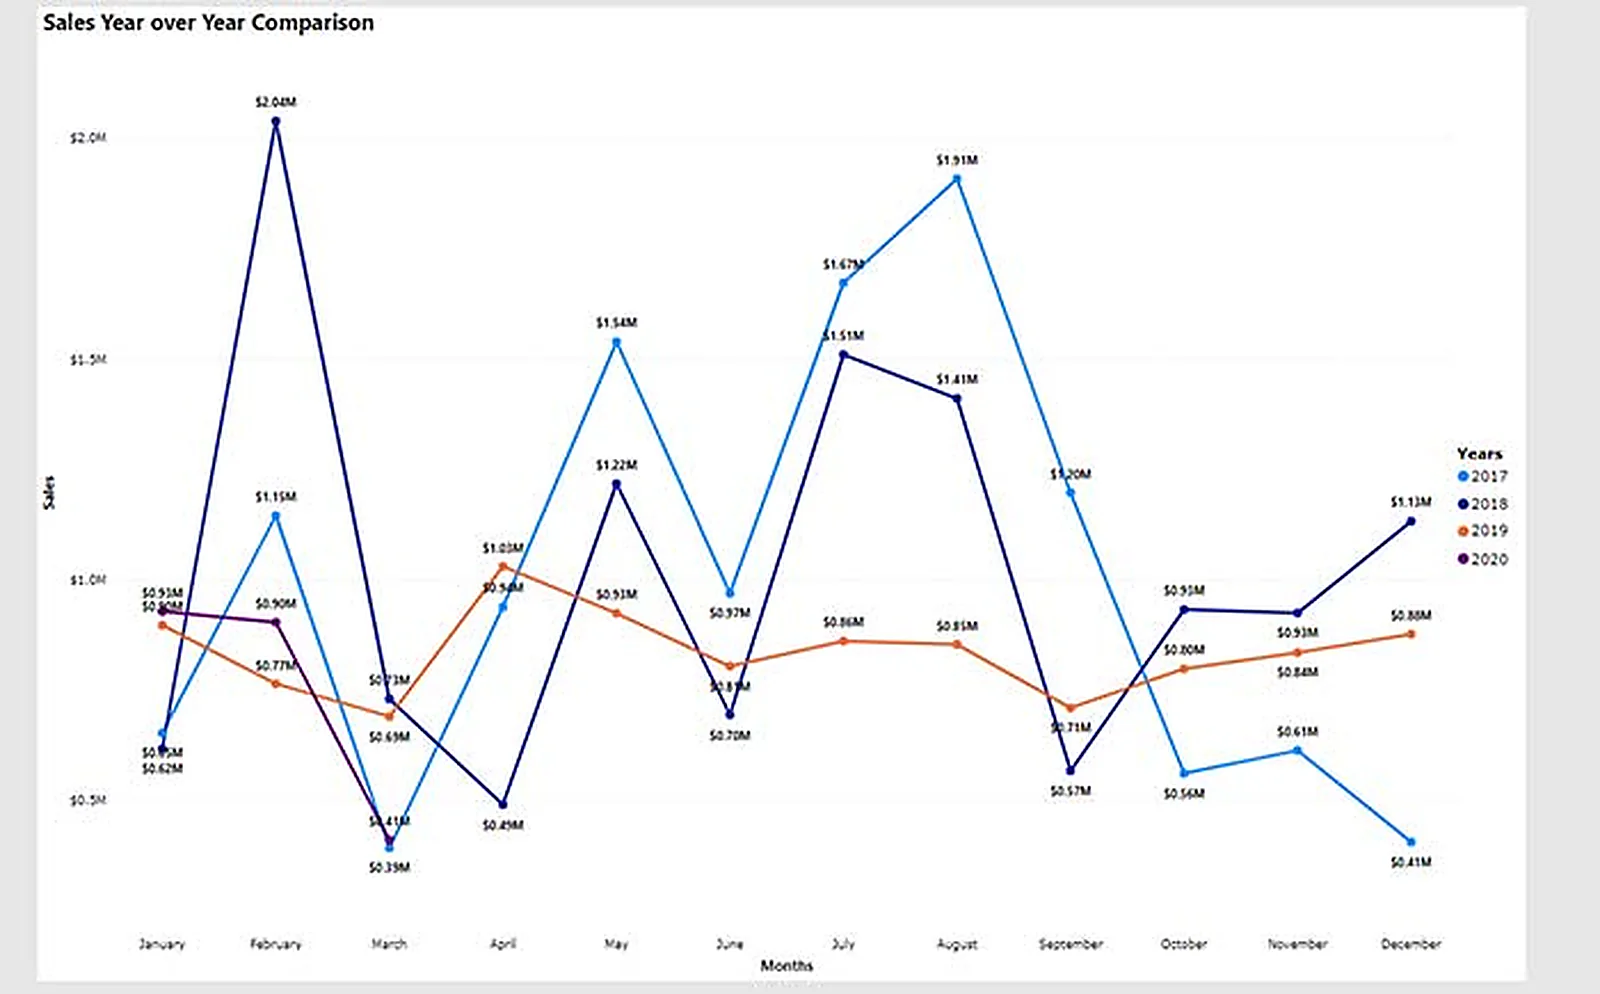 /01Analytics
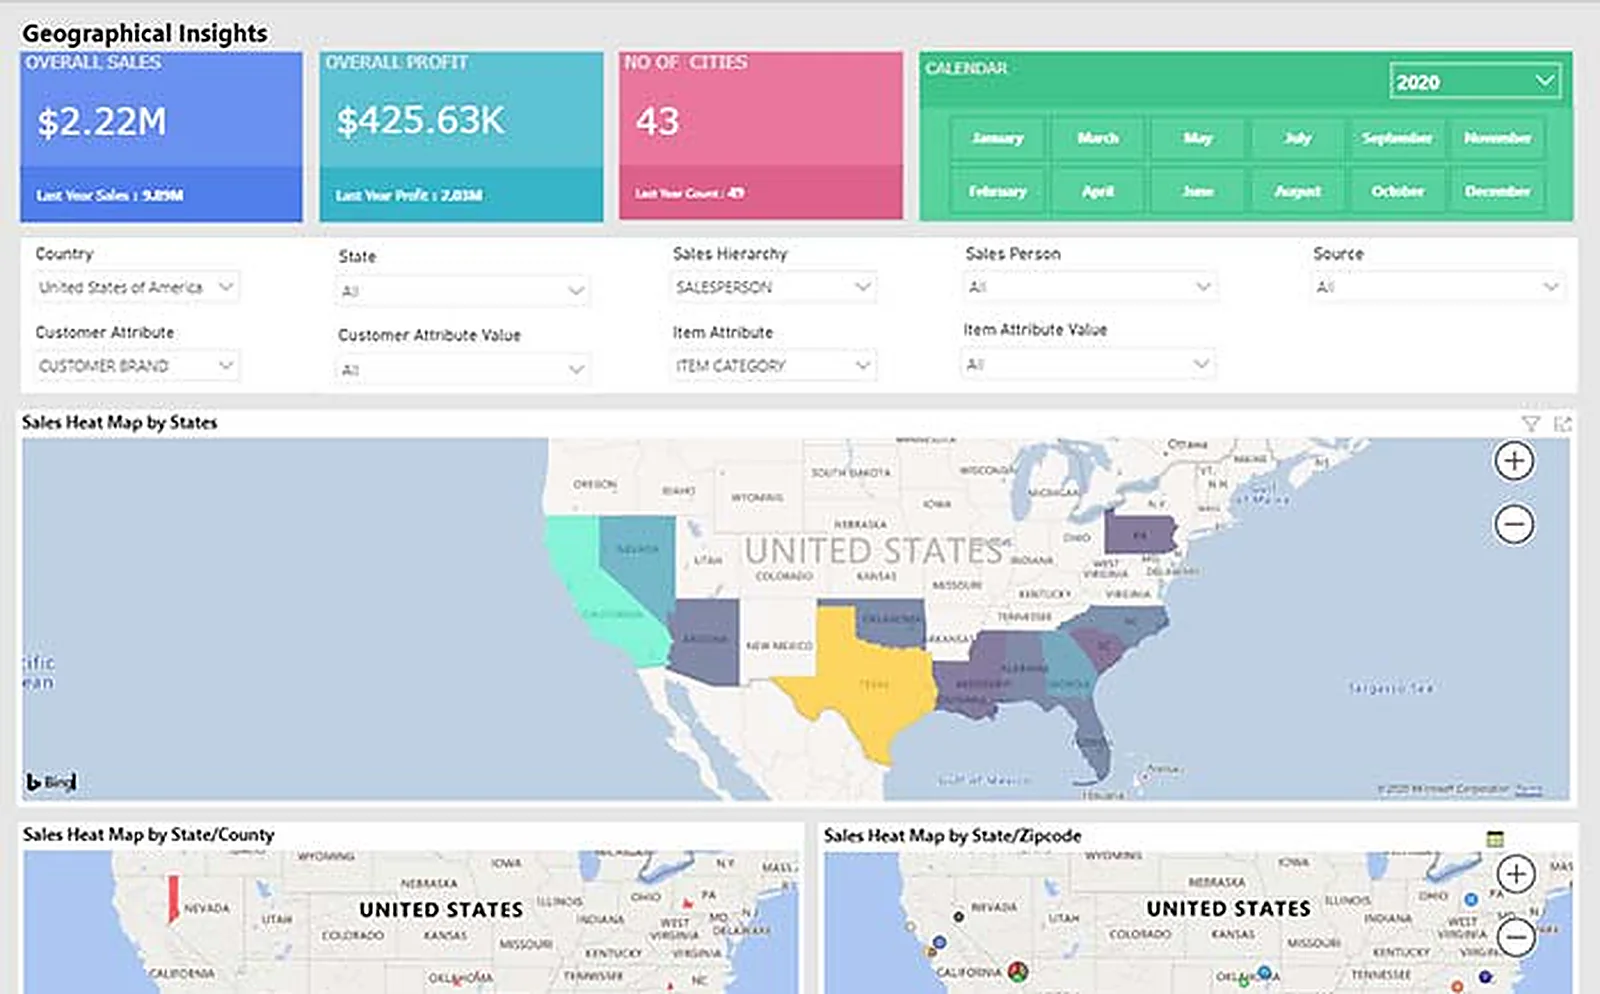 /02Geographical Reports
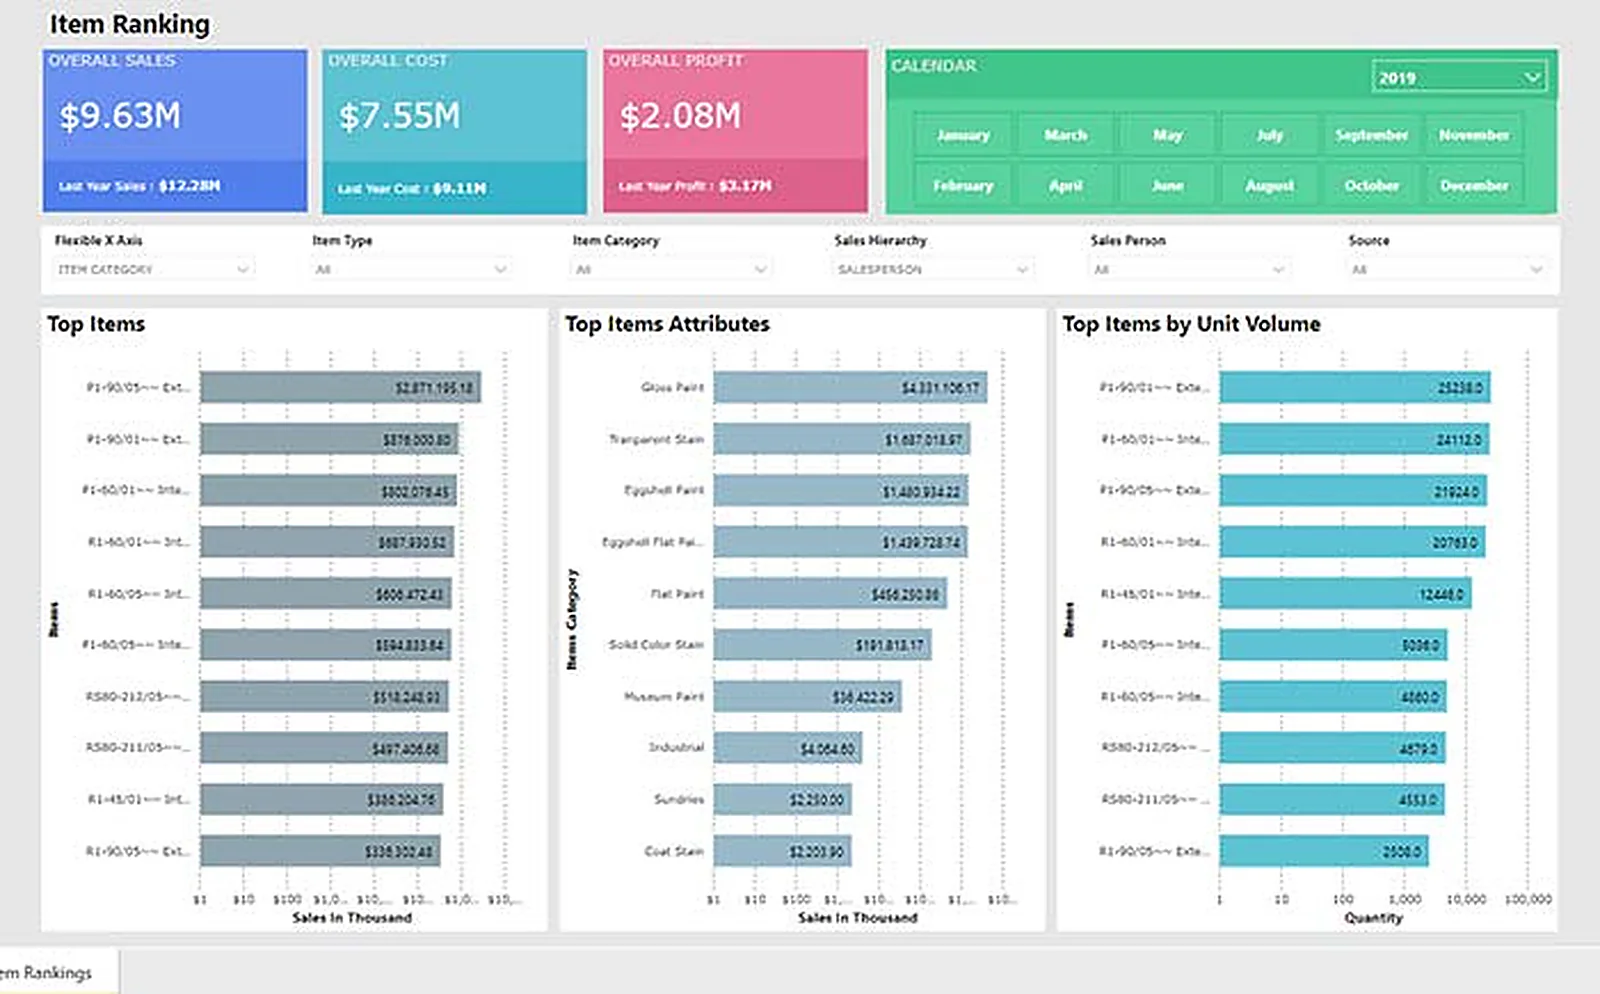 /03Item Ranking
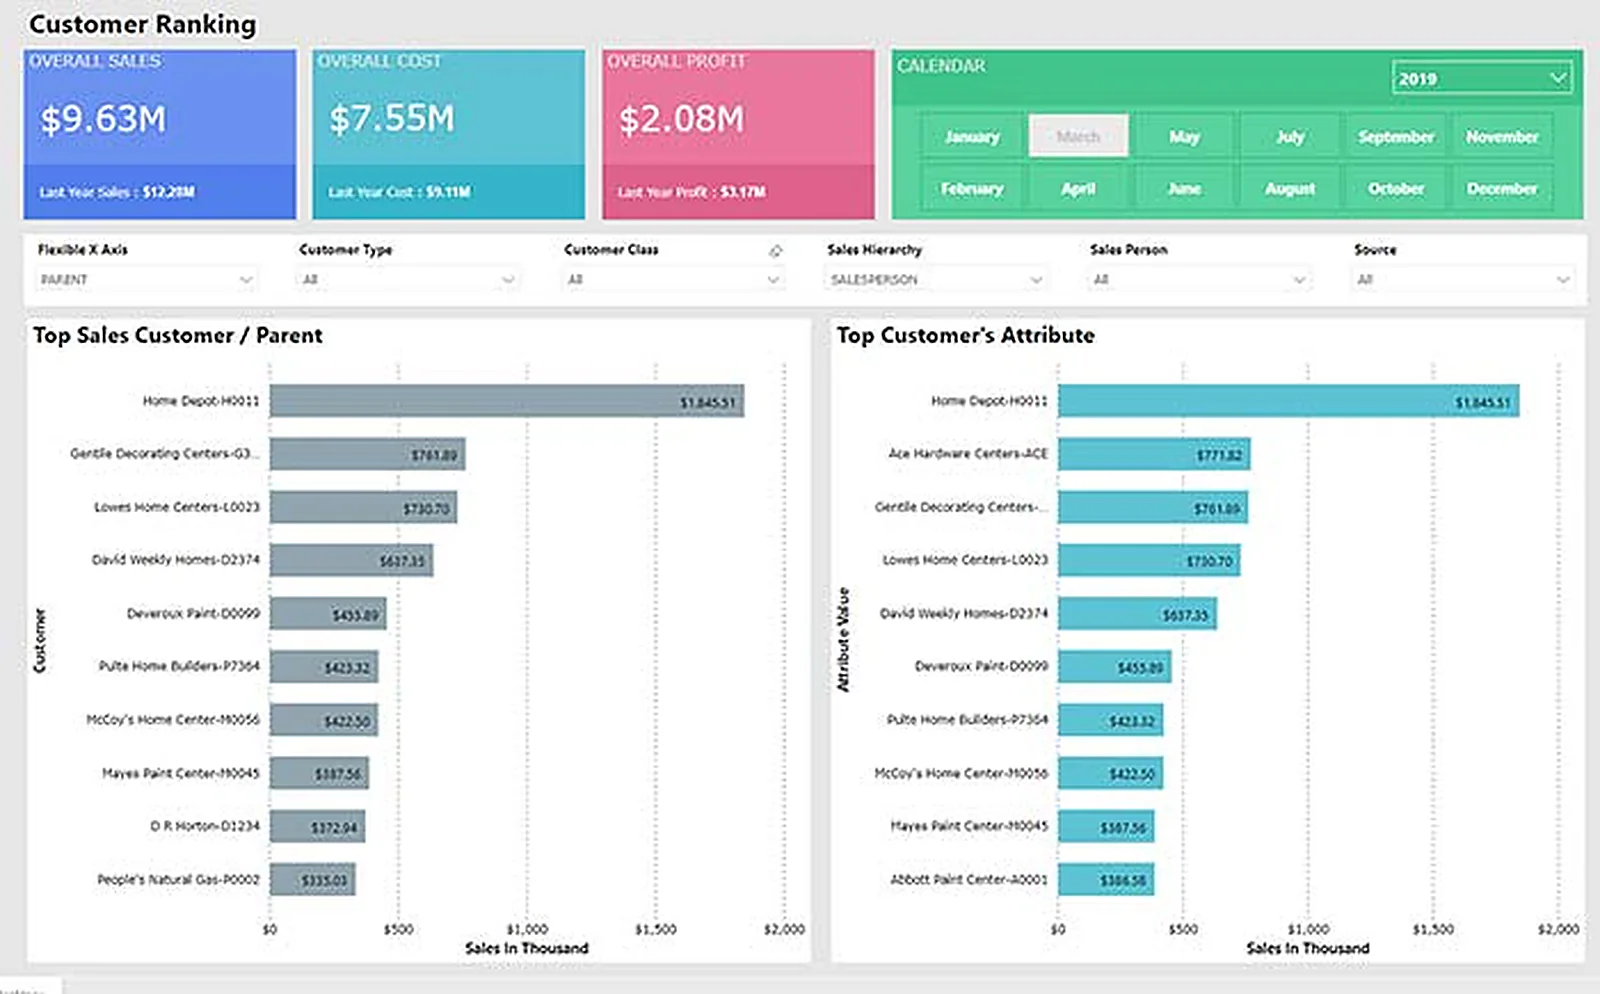 /04Monthly Sales
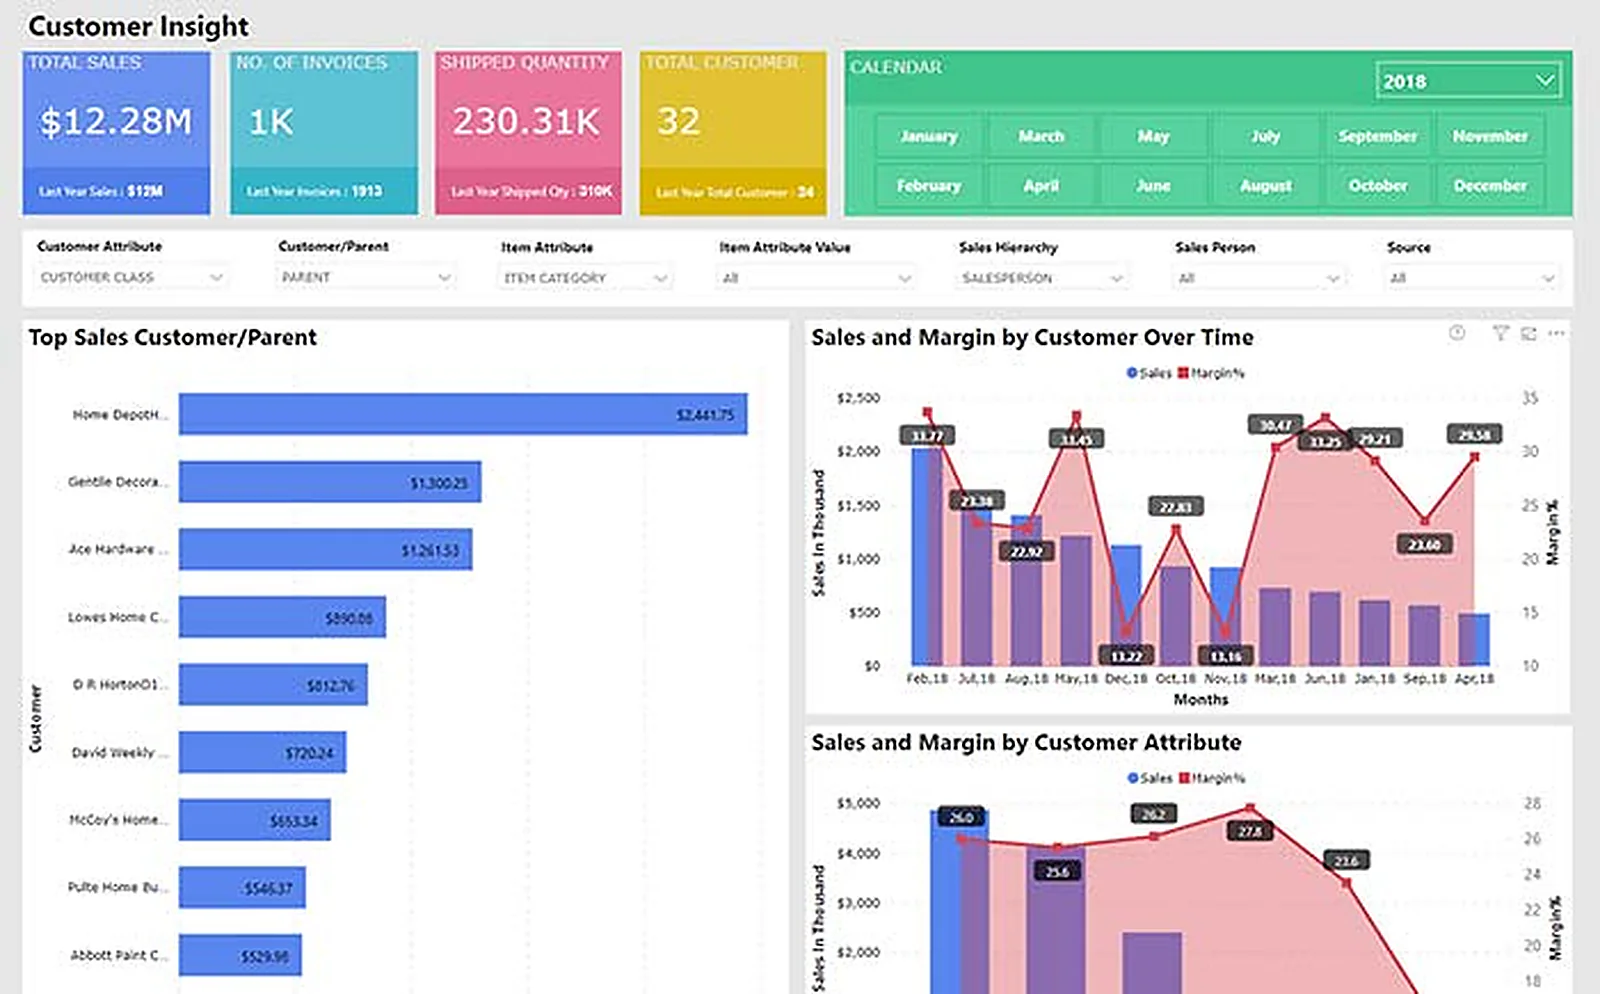 /05Weekly Sales
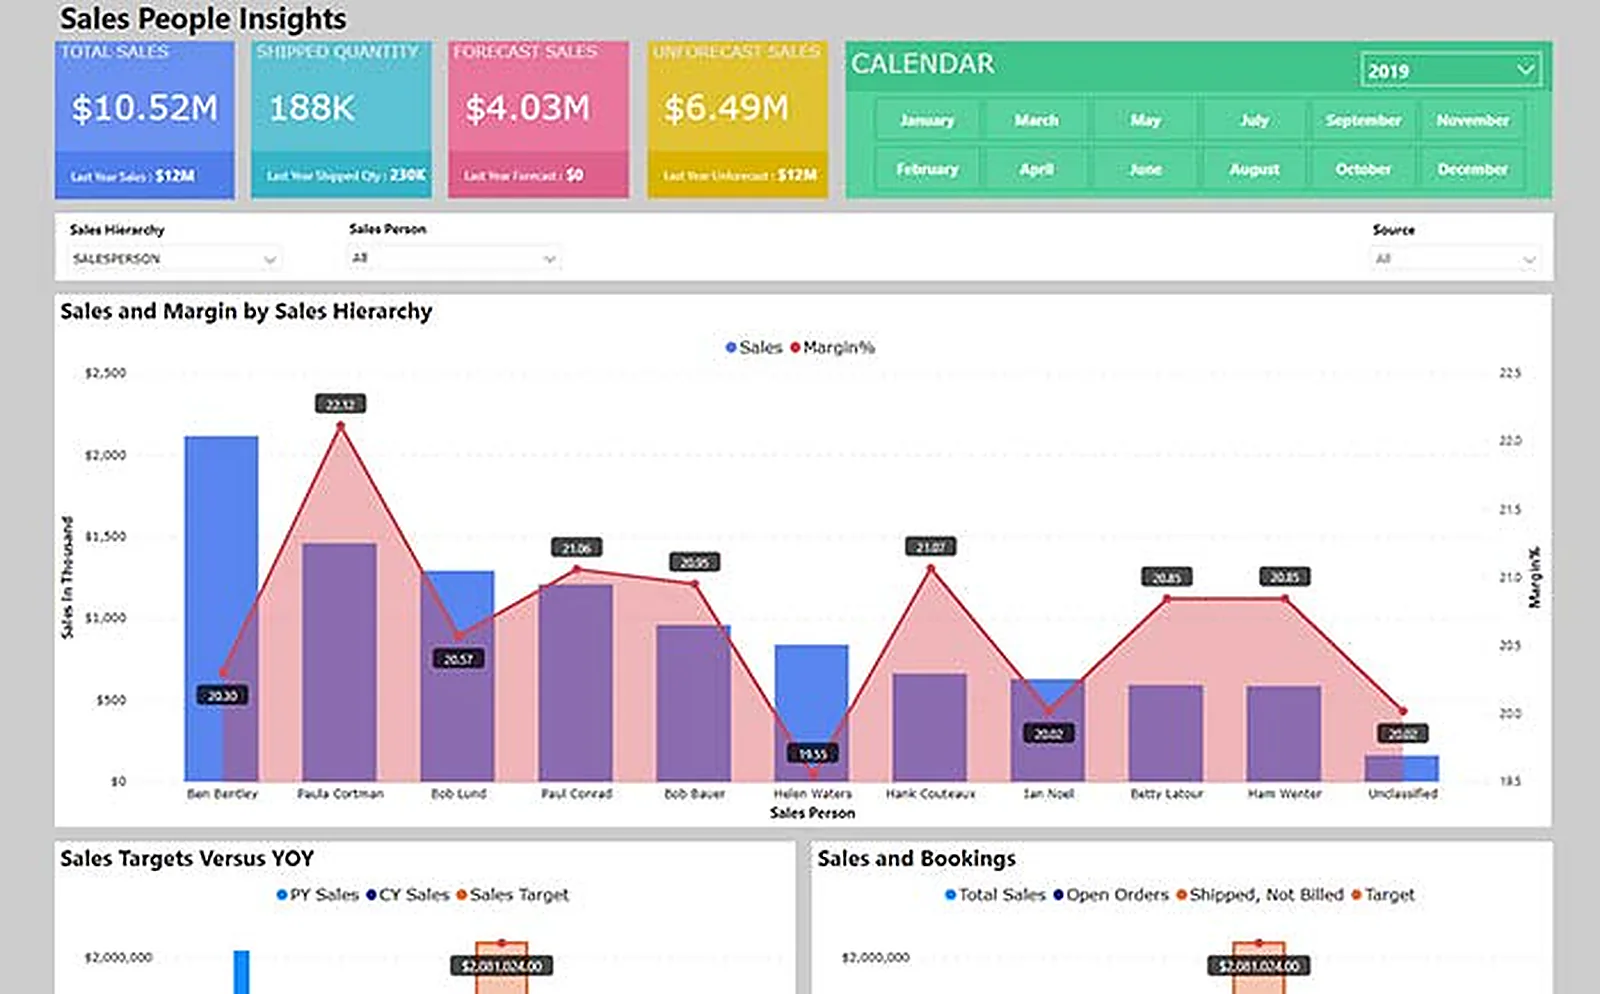 /06Yearly Sales
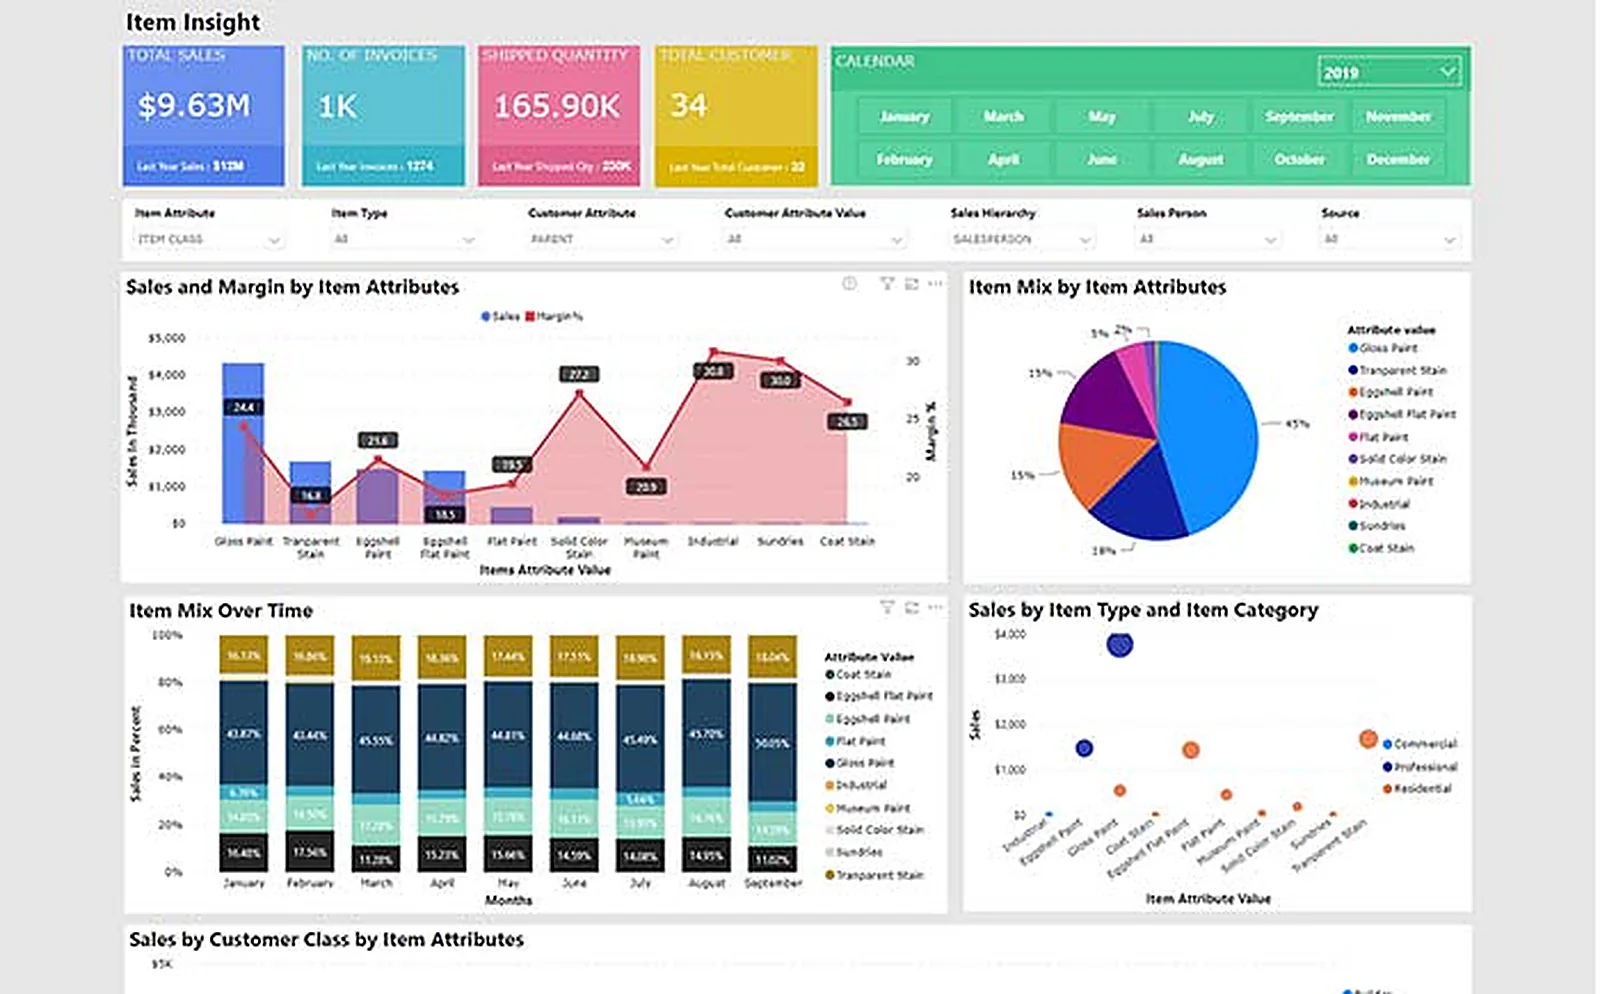 /07Sales Report
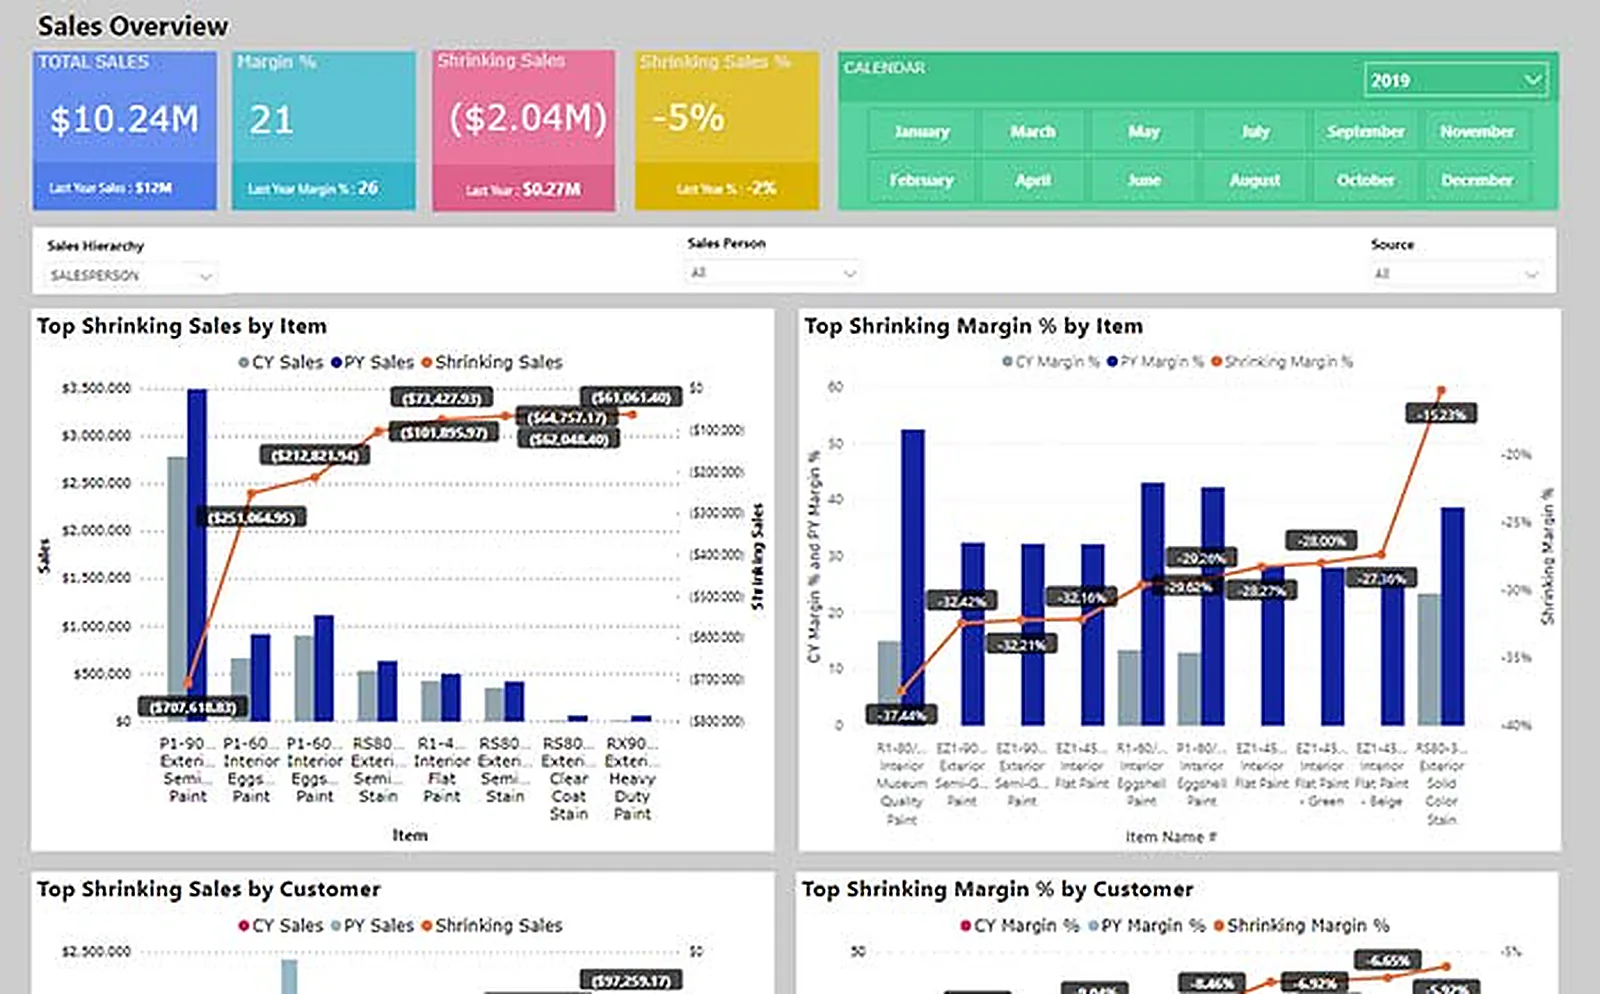 /08KPI Dashboard
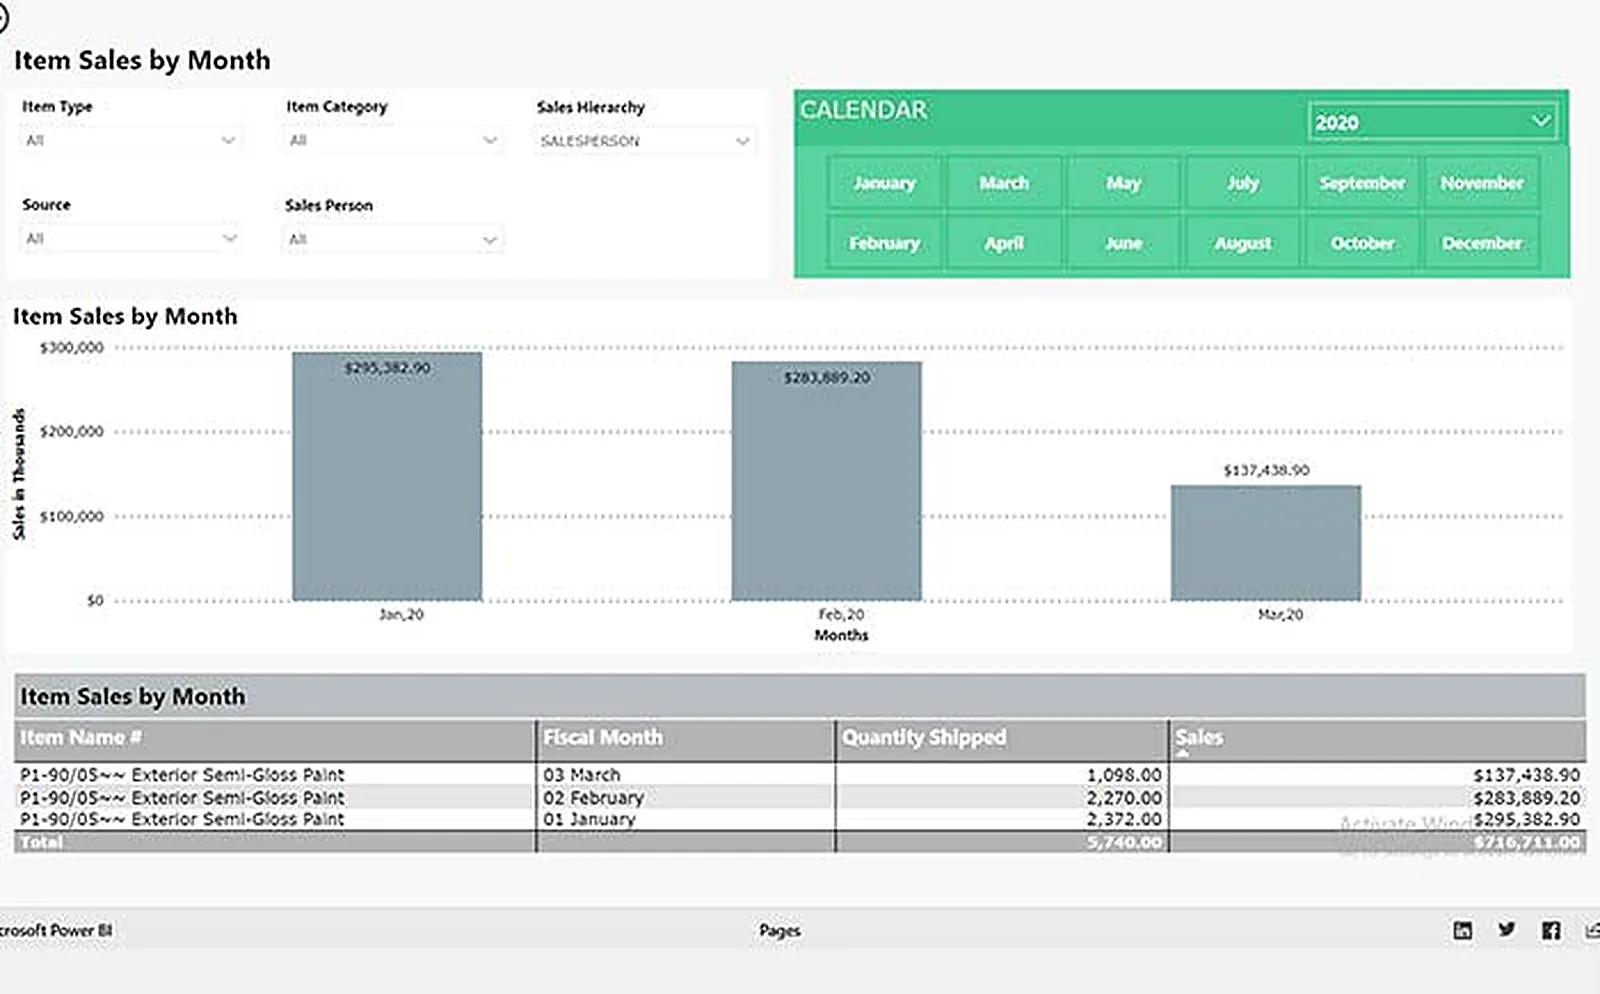 /09Overview
/ The results
What changed, in numbers.
/ Next step
Ready for a redesign like this on your platform?
A 30-minute working session with a Brainvire architect: your current stack, your constraints, and where a rebuild actually pays off. No sales deck.
Book a Working Session →Cookies on this site
Essential cookies are always on. They keep the site secure and make forms work.
We also use Google Analytics and Microsoft Clarity to see how the site is used. We only turn these on if you accept.