Top Google Play Store Statistics You Must Know
-

Maharshi Pancholi
The Google Play Store is the world’s largest app market, with over 2 million apps available. It is estimated that over 1 billion users have downloaded apps on the store. The top five countries with the most downloads on the Google Play Store are India, the United States, China, Japan, and Brazil.
The future of the Google Play Store is predicted to be brighter than ever, with its user base increasing to 3 billion by 2020 and 5 billion by 2025. The future of this platform is also full of opportunities for developers as it will help them reach out to a broader audience. In addition, it will also provide new ways for publishers to gain traction in their content marketing efforts through app marketing campaigns.
Total Number of Apps on Google Play Store
Google is a very well-known platform with millions of users who trust it and use it daily. Due to its popularity, Google Pay app developers have started to utilize this platform. This is why apps on the Play Store serve a variety of purposes.
Wondering how many apps are in the Google Play Store currently?
The Play Store has been growing rapidly and currently has over 3.5 million apps on it. By the end of 2022, it is predicted that there will be an increase.
Total Number of Apps Released Per Week And Month

There are no speed breakers at this point in the use of apps. A new app is added to the Play Store every day, and there are about 37,000. Hundreds of apps have been created every day, and the process, it has led to a huge increase in the number of mobile apps. Experts predict that this will be difficult to ignore in 2022
Total Number of Apps Downloaded Annually
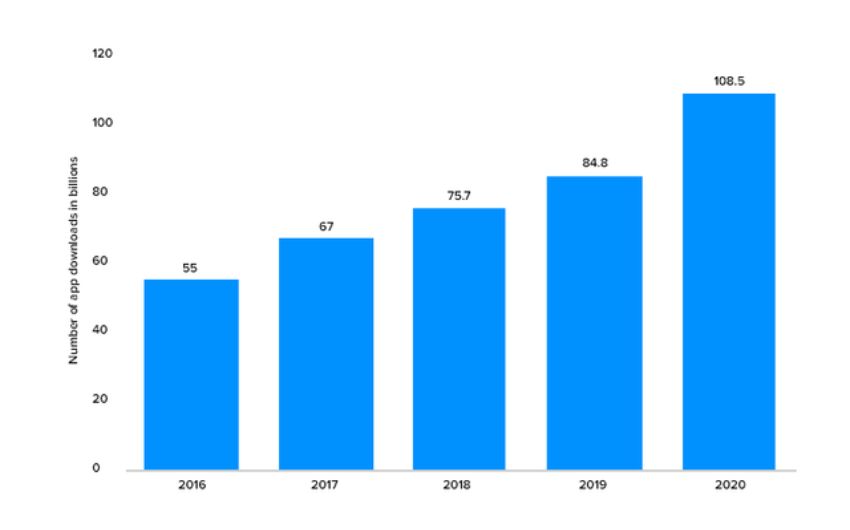
There is a high demand for apps of every category and niche, which has led to the number of downloads increasing in the last two years. This is because the demand for smartphones has seen a fast increase in recent years.
By 2020, the number of apps downloaded globally on Google Play was an impressive 108.5 billion, up from 76 billion in 2018. The app is available in a broader range of devices and dispatches significantly more downloads than the Apple App Store.
Google Play vs. App Store Downloads
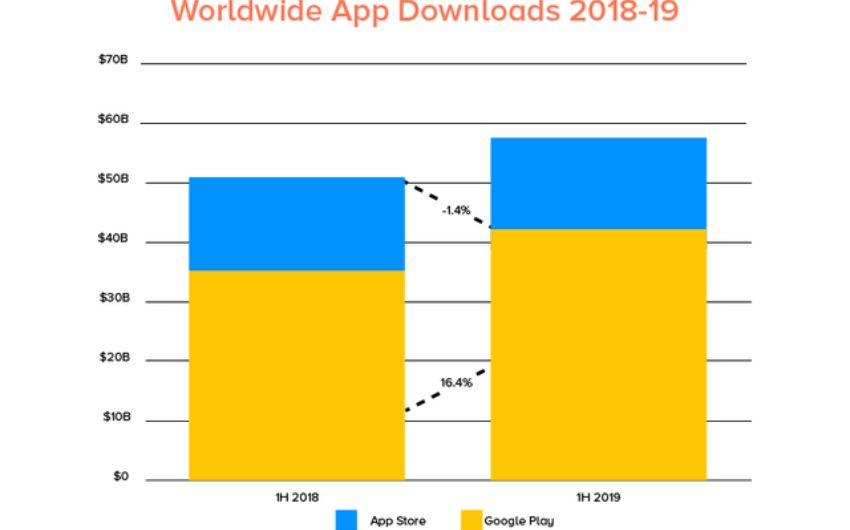
The popularity of Google Play has increased significantly, especially in the past few years. In 2016 it experienced a hike of 16.4%, and in 2018 it had an increase of 18%. In addition, the number of installs of Instagram in 2019 increased compared to last year. Apple’s App Store has shown remarkable growth in market share compared to the Google Play Store.
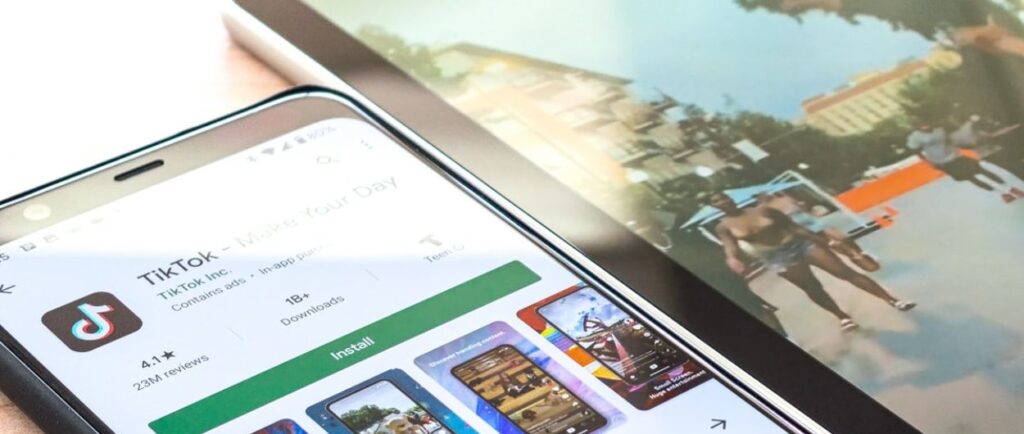
It’s no secret that Facebook, WhatsApp, and Messenger are Google Play’s top app. With over 880 million combined downloads, they competed with popular apps like TikTok.
Price Distribution

The average price of an app that you can find in the Google Play marketplace is somewhat around $1 to $2. This app seems to be under 10$ in total, but its star rating is 3.5. Since there are so many apps available for only $1, the preferred apps are likely those that come with a free trial.
Free and Paid Apps Downloads Statistics
Apps are traditionally either free or paid. Some research has shown that the Apple App Store has more paid apps than the Google Play Store. Apple users tend to make more in-app purchases, and that’s why many startups choose them over Android.
Free Android Apps
As of July 2021, about 96.9% of all Android applications were free on the Play Store. Most of the Google Play apps are free and don’t generate revenue through ads. So how do app developers make money?
Most app revenue comes from in-app purchases, accounting for 98% of revenue worldwide. A shift towards the freemium model has led to this trend of free apps. Although people are more likely to download and pay for an app than a game, people look for new business models that don’t involve spending on getting apps into their marketplaces.
Paid Android Apps
If we talk about paid apps personally, you might not have more than 2 or 3 apps on your device. To remain in the minority, you need to say that this is what’s true and make a sound business argument for it. Statista reports that there are currently about 3.1% of apps on the Google Play Store, a relatively low number as far as app downloads go.
Google Play Stats for Mobile App Usage
Generation X is more tech-savvy and relies on mobile apps to accomplish all their tasks. Millennials check their phones a lot, and those who own smartphones tend to open apps frequently. In 2017, 21% of millennials opened their apps 50+ times per day, and 49% of the overall smartphone demographic opened theirs 11+ times per day.
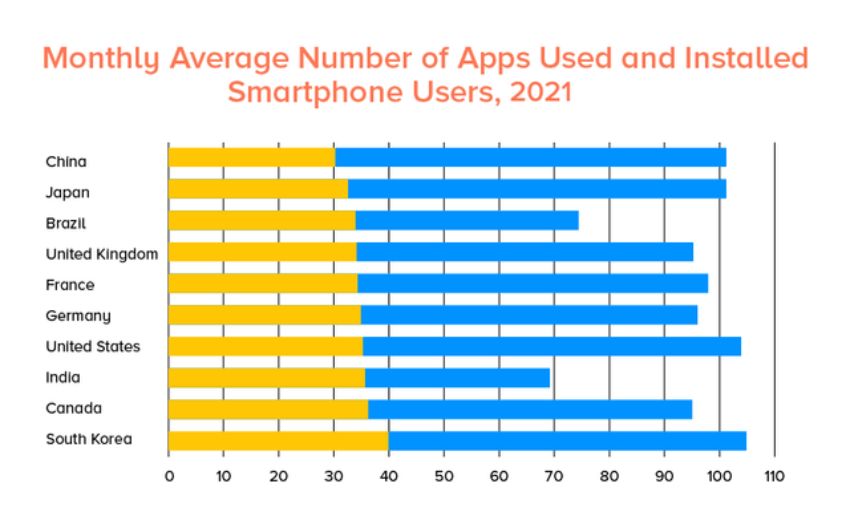
On average, smartphone users are using 30 apps every month or more. These facts are potential enough to convince you of the increasing usage of mobile apps, especially on the Google Platform.
Global Usage of Play Store Apps
There are 3.9 billion people in the world who use the internet, and 3.9 billion people live in areas that could be defined as “mobile networks.”
Approximately 66.85% of the world’s population has a mobile device today, according to GSMA data.
Emerging markets like India and the Philippines fall under a category that emphasizes mobile-first marketing. This indicates that consumers primarily use smartphones as their primary way to access the internet in these markets. Moreover, according to top Google Play statistics, most of the apps downloaded are for the Android platform.
You can save a lot of time and effort by conducting business on your smartphone. You can find and use apps for almost everything.
In short, people of different age groups have begun to become more aware and significantly avid users of technology. This metric illustrates the evolution and share for apps on the Google Play Store as it grows over time.
App Usage by Age

It is generally assumed that younger generations spend more time on mobile apps than people of the older generation. Generation X is typically more interested in tech. This trend has continued even into 2018.
However, that doesn’t mean you can’t target the other age groups. If you look at the graph, you will find app usage statistics by frequency of opening on people belonging to different age brackets.
It seems that Millennial app usage is growing, with the average number of app opens rising to 10.5 in a single day (including 18-34-year-olds). In addition, teenagers spend 9.4 hours a day on screens, a trend that is predicted to grow in the coming years.
US app users aged 13-64 open their apps 8.3 times per day on average, as per Google Play stats.
Usage by Devices

As smartphones become more widespread, people can now use them to access the internet wherever there is access. They also use other devices to meet their internet-consumption needs, like laptops and desktops. Some specific app categories are seeing high usage on Smartphones. These include Maps, Instant messengers, Music, Games, photos, weather – etc.
In the past, Desktops were still being used at workplaces. However, they are typically used for various purposes that make them an ideal choice.
Mobile browsing on the go has been a blessing and a curse. Similarly, we have noticed that every country spends hours in these instances. Argentina has the most amount of mobile time and America, Spain and Italy but India seems to spend the least amount of their time on mobile.
Usage by Country
The location has an impact on app behavior & the stats in general. For example, when more users feel content with an app, more app downloads occur, and the system is said to be in a state of health.
Here are the top Google Play Store statistics of 2021, with data on app users worldwide. Developers can use the information in this report to learn about their audience and potential markets. In addition, this report is beneficial when planning the app localization strategies.
South Korea is the top market, with the US and Japan second and third place on the list.
Gross App Revenue
The iOS App Store & Google Play Apps generated $111 Billion in revenue in 2020, a 24% increase from 2019. 2020 was a big year for Google Play Store, with $38.6 billion in revenue predicted for that year. A 167% increase in less than four years shows just how popular paid apps are on Android.
The Google Play Store economy stats are improving every year so that you can count on more opportunities for your app. There are currently many lucrative options for app developers looking to generate income. One of those is the Google Pay app, which offers income through specific advertising space that it can purchase
Although some might say that Apple’s high prices keep Android users away from the iOS platform, it’s tough to deny that Google Play is catching up with revenue growth.
If you’re thinking about developing an Android app, various reputed companies can help you. Contact one of them, and they’ll be happy to share android app development services with you.
Related Articles
-
 Android Application Development – Reasons of Success
There is no deny that Android is one of the most popular operating system these days and highly preferred choice for mobile app development as it offers plethora of advanced
-
 Top 20 Android App Development Trends in 2021 that Shouldn’t be Missed
Android apps have become an indispensable part of our daily lives. As a result of the COVID-19 pandemic, there was a significant increase in demand for specific app categories. Users
-
 Accel – Another Investor In Android Keyboard Maker SwiftKey In Its $17.5M Series B!!!
SwiftKey, an alternative Android Keyboard-maker company, has recently added another investor in its upcoming $17.5 million series B. The company is soon going to launch software in more 100 million