Home / Case Studies / Finance Market Leader

/ Case Study · Finance

Data Cleansing and Analytics With PowerBI. Scattered Data, One Clear View.

/ The engagement

A PowerBI Data Management Solution.

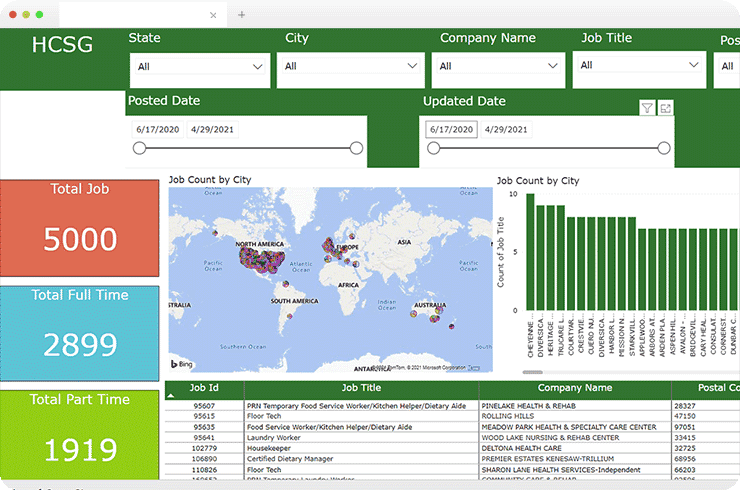
The client is a well-established North American finance company offering portfolio management services, and its business system had accumulated a massive amount of financial data that was hard to align and use. Brainvire built a customized PowerBI solution that runs the whole process from data collection to reporting, with data extraction, cleansing, and quick graphical reports.

PowerBIData ExtractionData CleansingKPI Reporting
PowerBIAnalytics engine
Multi-sourceData unified
KPIDriven reports
FasterDecision making

/ About the client

Finance Market Leader

The client is a well-established finance company in North America that offers portfolio management services. Its existing business system had accumulated a massive amount of financial data, which made it difficult to align all the data and use it effectively to manage financial portfolios. It reached out to Brainvire for an advanced data and money management software solution.

Brainvire analyzed the crux of the company and concluded that PowerBI was the right solution. The entire data management process, from data collection to reporting, runs seamlessly through this advanced solution, so the client can align diverse data and put it to work.

/ The approach

Design, architecture, and features, shipped as one program.

/01Sources

Data, traced

The company drew data from multiple sources that were tricky to trace, so customized data extraction methods sync with the relevant parameters and let the client find the roots of its data.

/02Cleansing

Sets, aligned

Data cleansing was mundane and time-consuming, so logical data parsing parameters align the process and construct accurate data sets the client can trust.

/03Conclusions

Output, optimized

Diverse data made it hard to draw the right conclusion, so business logic in PowerBI traces the client's needs, highlights KPIs, and displays the optimal output.

/04Reports

Insight, at speed

A never-ending data sheet slowed decisions, so PowerBI tools generate quick reports on the desired data and improve decision-making capabilities.

/ What stood in the way

Four problems, solved without a maintenance window.

Select a challenge to see how it shaped the build.

/01 Analyze the data pattern
/02 Data cleansing
/03 Optimal conclusion
/04 Clear data representation

Analyze the data pattern

The company obtained data from multiple sources, and it was tricky to trace its roots. The team implemented customized data extraction methods in sync with the relevant parameters, so the client could align and manage its data with confidence.

Data cleansing

Earlier, data cleansing appeared mundane, time-consuming, and fruitless. The team introduced appropriate logical data parsing parameters to align the cleansing process and construct accurate data sets.

Optimal conclusion

With diverse data and sources, it was confusing to draw the right conclusion. The customized PowerBI solution carries business logic that traces the client's needs, highlights KPIs, and displays the optimal output.

Clear data representation

A never-ending data sheet made drawing a reliable outcome a lengthy process. With PowerBI tools, the company generates quick reports based on its desired data and improves decision-making.

/ Product screens

The delivered experience.

The interface people actually use.

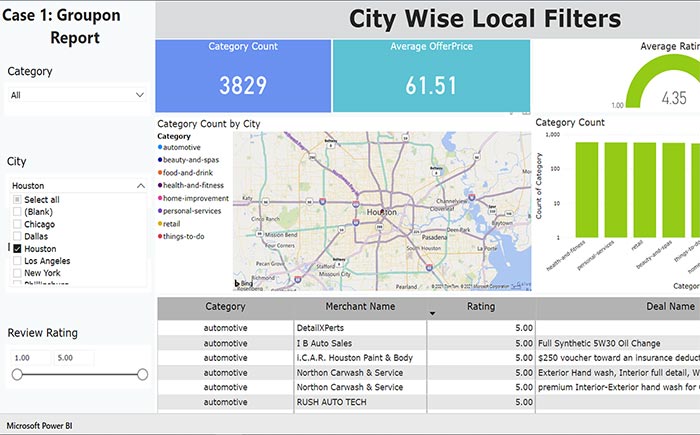
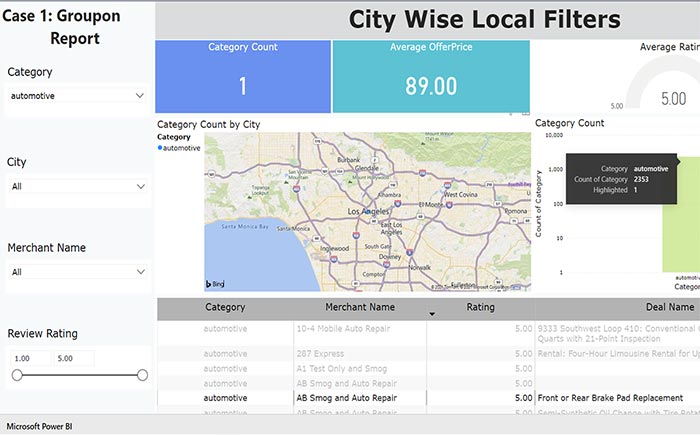
Finance Market Leader delivered interface, screen 1/01Dashboard
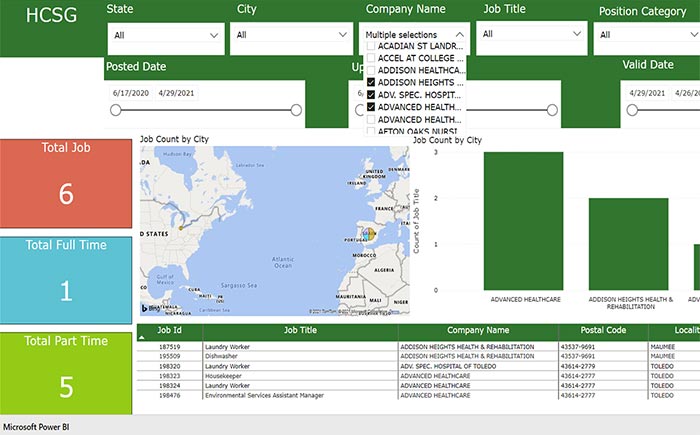
Finance Market Leader delivered interface, screen 2/02Data Sources
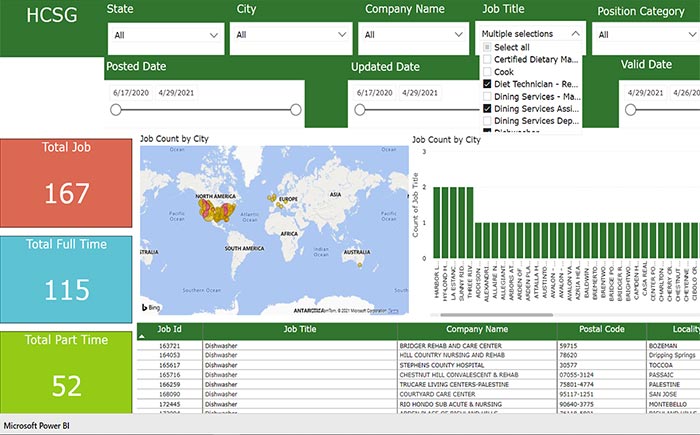
Finance Market Leader delivered interface, screen 3/03Cleansing
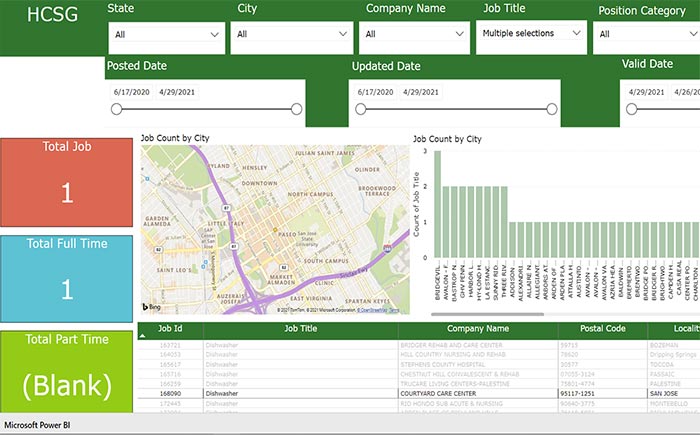
Finance Market Leader delivered interface, screen 4/04KPI Report
Finance Market Leader delivered interface, screen 5/05Charts

/ The results

What changed, in numbers.

Unified Multiple sources Multiple algorithms made it convenient for the company to manage multiple sources from a single system.
Faster Data processing With the algorithms and PowerBI in place, the company processes massive data quickly, draws accurate conclusions, and makes smart decisions.
Clear Graphical reports PowerBI converts lengthy data into pie charts and other graphical representations that make reporting readable.
Improved Data management The company gained more time and resources for portfolio management and no longer has to deal with data hassles.

/ Next step

Ready for a redesign like this on your platform?

A 30-minute working session with a Brainvire architect: your current stack, your constraints, and where a rebuild actually pays off. No sales deck.

Book a Working Session →