About
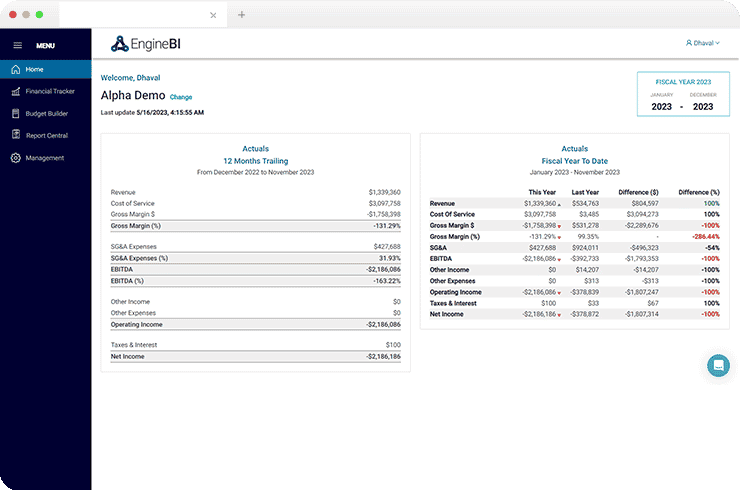
The client is a SaaS-based product company based in North America. Their offerings help businesses and institutions to manage their finances efficiently. Their clientele primarily comprises leaders and marketing agency executives of all sizes. Customers can opt for the login subscription and view the desired financial reports for their company. Their software helps businesses visualize financial information and identify key opportunities so that they can completely focus on growing their business.
Project Highlights
The team built various reports in charts and graphical form that the client can present to their customers, including gross margin report monthly, gross profit report monthly, gross profit report by LOB monthly, gross profit monthly performance, revenue report monthly, cost of service report monthly, and cumulative report monthly. These reports help keep track of an organization’s finances and allow the leaders to focus entirely on the business growth.
The Challenges
- Gross Profit Calculation:Gross Profit Calculation for forecasting based on the month-locking scenario on selecting the respective budget name.
- YTD Calculation:YTD calculation based on budget name selection.
- LIVE Database Transformations:Showcasing YTD, Actuals, Forecast, and Total values in a single row.
- Displaying Gross Margin Values:Handling Null/Zero values in the revenue column.
Tech Stack
Power BI
MySQL
Azure DevOps
SQL SERVER
Result
Simplified Gross Profit Calculation
Creating the required table structure based on the filter selection on the budget name enabled the client to show months locked in a particular quarter and their respective ‘Actual Value’ along with the ‘Forecasted Value’ for the remaining months in that year.Single Row Header for YTD, Actuals, Forecast, and Total Values
Creating a calculated column in the power query allowed the client to show YTD, Actuals, Forecast, and Total values in a single row header and perform calculations like Gross Profit and Gross Margin based on it.Budget Building Made Easy
Created columns for the calculation of YTD, Total, Gross Profit, and Gross Margin and summarized them with DAX to develop the structure, enabled the client to show YTD, Actuals, Forecast, and Total values in a single row header and calculate Gross Profit and Gross Margin. We also created separate tables for Revenue, COS, and Gross Profit because their data type differs from Gross Margin.Simplified Decision Making
Replacing Zero/Null values with ‘0.01’ in red and restricting it up to four decimal places helped the client avoid calculation errors and made decisions simpler for leadership.
